

Chart of year Inkofen / Amper
Discharge from 01.01.2024 to 25.04.2024
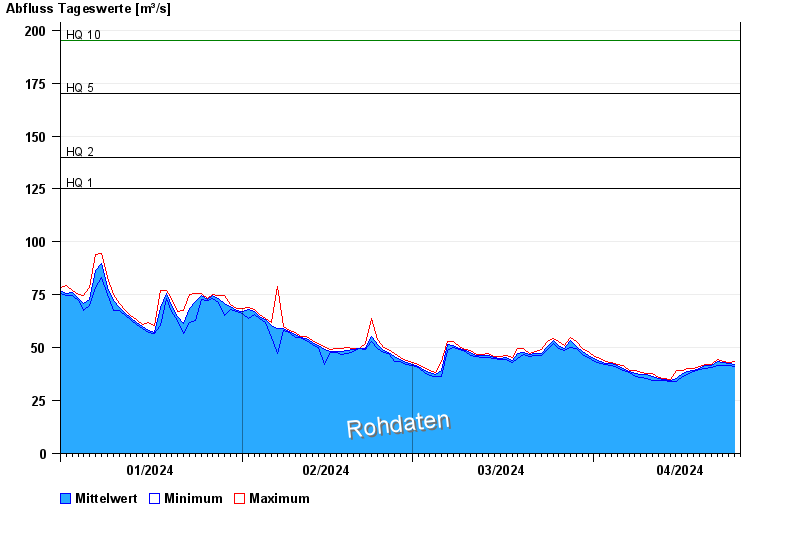
- HQ1 125 m³/s
- HQ2 140 m³/s
- HQ5 170 m³/s
- HQ10 195 m³/s
- HQ20 220 m³/s
- HQ50 255 m³/s
- HQ100 280 m³/s
| Date | Mean value [m³/s] | Maximum [m³/s] | Minimum [m³/s] |
|---|---|---|---|
| 25.04.2024 | 43.2 | 43.2 | 43.2 |
| 24.04.2024 | 42.3 | 43.2 | 41.7 |
| 23.04.2024 | 43.1 | 43.7 | 41.7 |
| 22.04.2024 | 43.7 | 44.3 | 41.7 |
| 21.04.2024 | 41.5 | 42.2 | 40.7 |
| 20.04.2024 | 41.4 | 42.2 | 40.2 |
| 19.04.2024 | 40.2 | 41.2 | 39.7 |
© Bayerisches Landesamt für Umwelt 2024