

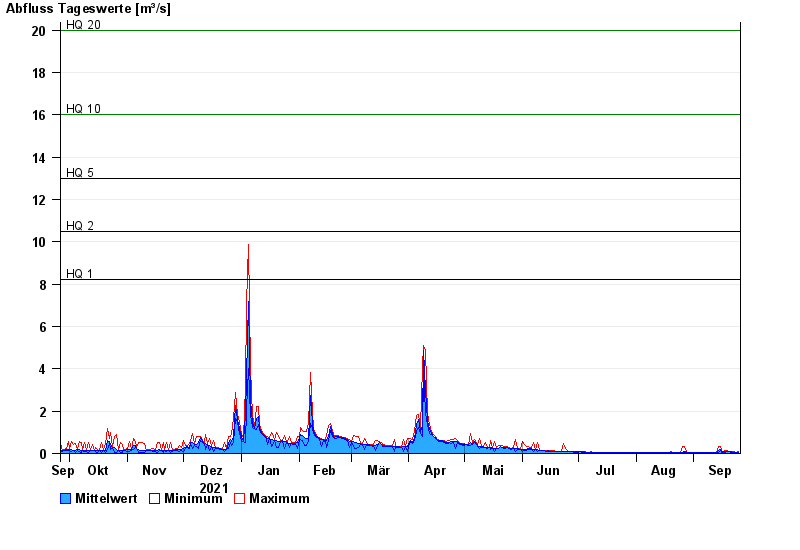
Chart of year Illesheim / Aisch
Discharge from 26.09.2021 to 25.09.2022
note
Wasserstand und Abfluss wird zeitweise durch Biberdamm beeinflusst.
- HQ1 8,2 m³/s
- HQ2 10,5 m³/s
- HQ5 13 m³/s
- HQ10 16 m³/s
- HQ20 20 m³/s
- HQ50 27 m³/s
- HQ100 32 m³/s
| Date | Mean value [m³/s] | Maximum [m³/s] | Minimum [m³/s] |
|---|---|---|---|
| 25.09.2022 | 0.058 | 0.081 | 0.048 |
| 24.09.2022 | 0.049 | 0.055 | 0.043 |
| 23.09.2022 | 0.056 | 0.077 | 0.04 |
| 22.09.2022 | 0.064 | 0.091 | 0.052 |
| 21.09.2022 | 0.071 | 0.082 | 0.059 |
| 20.09.2022 | 0.09 | 0.106 | 0.082 |
| 19.09.2022 | 0.116 | 0.127 | 0.106 |
© Bayerisches Landesamt für Umwelt 2024