

Chart of year Illesheim / Aisch
Discharge from 08.12.2019 to 07.12.2020
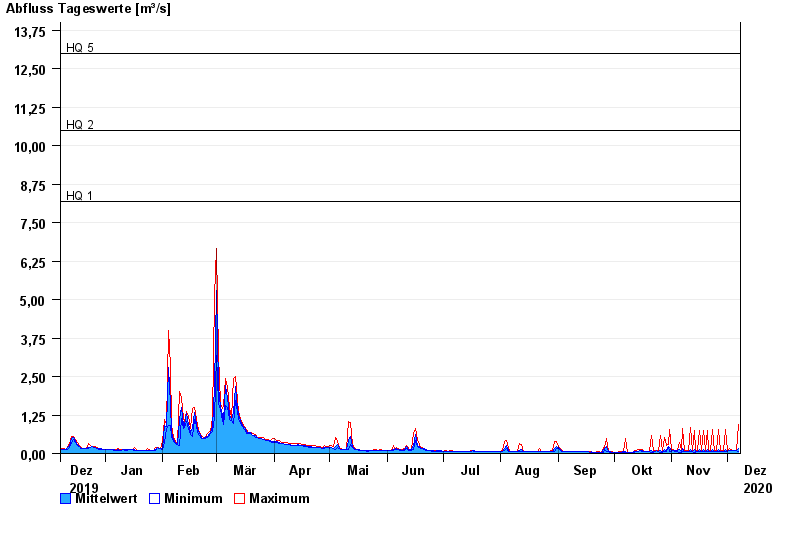
note
Wasserstand und Abfluss wird zeitweise durch Biberdamm beeinflusst.
- HQ1 8,2 m³/s
- HQ2 10,5 m³/s
- HQ5 13 m³/s
- HQ10 16 m³/s
- HQ20 20 m³/s
- HQ50 27 m³/s
- HQ100 32 m³/s
| Date | Mean value [m³/s] | Maximum [m³/s] | Minimum [m³/s] |
|---|---|---|---|
| 07.12.2020 | 0.171 | 0.949 | 0.069 |
| 06.12.2020 | 0.092 | 0.097 | 0.088 |
| 05.12.2020 | 0.088 | 0.101 | 0.084 |
| 04.12.2020 | 0.09 | 0.101 | 0.087 |
| 03.12.2020 | 0.095 | 0.12 | 0.091 |
| 02.12.2020 | 0.105 | 0.154 | 0.082 |
| 01.12.2020 | 0.063 | 0.095 | 0.053 |
© Bayerisches Landesamt für Umwelt 2024