

Chart of year Illesheim / Aisch
Discharge from 01.01.2020 to 31.12.2020
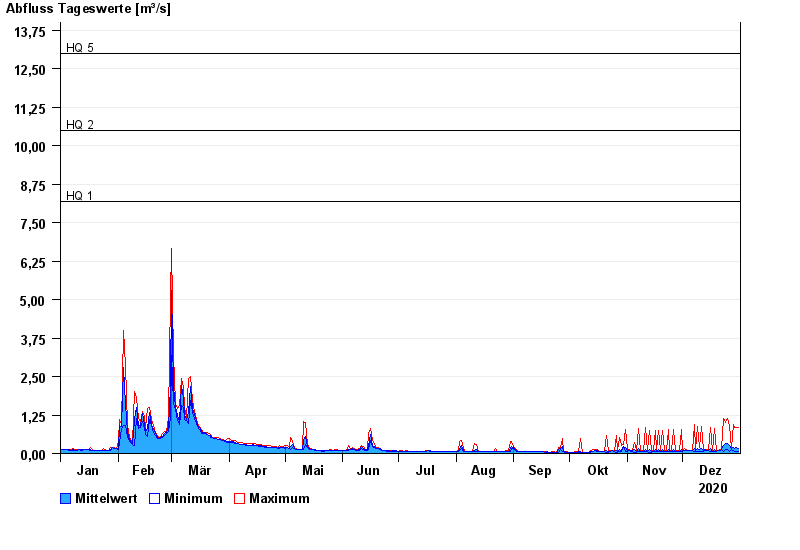
note
Wasserstand und Abfluss wird zeitweise durch Biberdamm beeinflusst.
- HQ1 8,2 m³/s
- HQ2 10,5 m³/s
- HQ5 13 m³/s
- HQ10 16 m³/s
- HQ20 20 m³/s
- HQ50 27 m³/s
- HQ100 32 m³/s
| Date | Mean value [m³/s] | Maximum [m³/s] | Minimum [m³/s] |
|---|---|---|---|
| 31.12.2020 | 0.154 | 0.832 | 0.067 |
| 30.12.2020 | 0.179 | 0.839 | 0.067 |
| 29.12.2020 | 0.172 | 0.854 | 0.071 |
| 28.12.2020 | 0.206 | 0.926 | 0.092 |
| 27.12.2020 | 0.159 | 0.168 | 0.144 |
| 26.12.2020 | 0.27 | 0.923 | 0.068 |
| 25.12.2020 | 0.336 | 1.15 | 0.138 |
© Bayerisches Landesamt für Umwelt 2024