

Chart of total period Holnstein / Unterbürger Laber
Discharge from 01.11.1982 to 25.04.2024
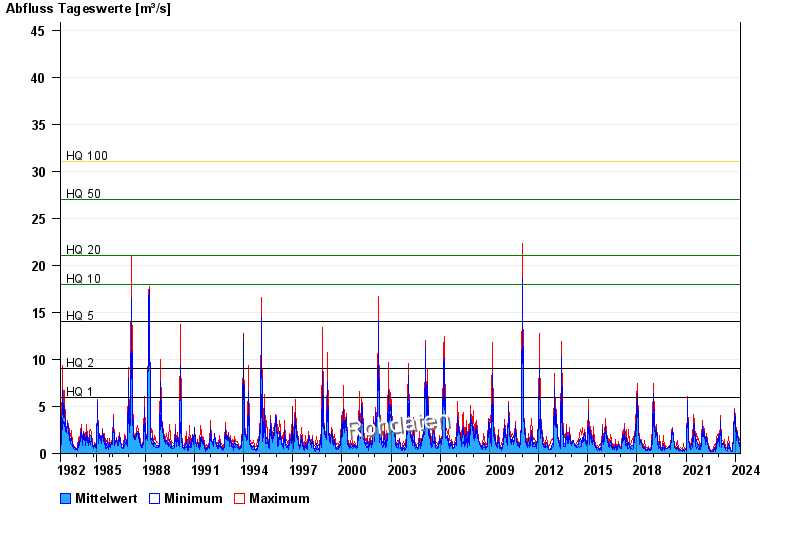
- HQ1 6 m³/s
- HQ2 9 m³/s
- HQ5 14 m³/s
- HQ10 18 m³/s
- HQ20 21 m³/s
- HQ50 27 m³/s
- HQ100 31 m³/s
| Date | Mean value [m³/s] | Maximum [m³/s] | Minimum [m³/s] |
|---|---|---|---|
| 25.04.2024 | 0.973 | 1.07 | 0.969 |
| 24.04.2024 | 1.02 | 1.07 | 0.969 |
| 23.04.2024 | 1.13 | 1.18 | 1.07 |
| 22.04.2024 | 1.28 | 1.41 | 1.18 |
| 21.04.2024 | 1.29 | 1.41 | 1.18 |
| 20.04.2024 | 1.44 | 1.78 | 1.18 |
| 19.04.2024 | 0.918 | 1.41 | 0.794 |
© Bayerisches Landesamt für Umwelt 2024