
- Start >
- Rivers >
- Discharge >
- Regnitz >
- Heitzenhofen >
- Chart of total period

Chart of total period Heitzenhofen / Naab
Discharge from 01.11.1920 to 25.04.2024
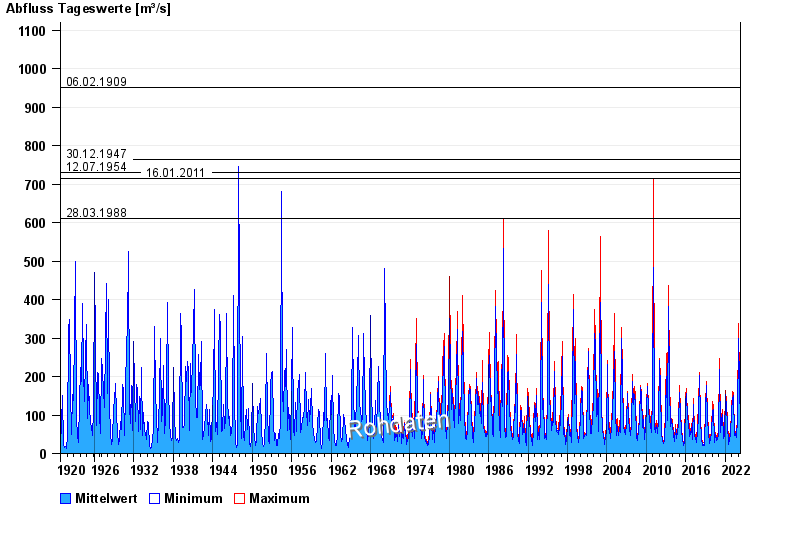
- 06.02.1909 Abfluss: 950 m³/s
- 30.12.1947 Abfluss: 765 m³/s
- 12.07.1954 Abfluss: 730 m³/s
- 16.01.2011 Abfluss: 715 m³/s
- 28.03.1988 Abfluss: 611 m³/s
| Date | Mean value [m³/s] | Maximum [m³/s] | Minimum [m³/s] |
|---|---|---|---|
| 25.04.2024 | 60.4 | 63.4 | 56.2 |
| 24.04.2024 | 68.1 | 73 | 63.4 |
| 23.04.2024 | 74.5 | 80.1 | 72.3 |
| 22.04.2024 | 79.4 | 81.6 | 76.5 |
| 21.04.2024 | 69.4 | 76.5 | 61.4 |
| 20.04.2024 | 52.3 | 61.4 | 46.9 |
| 19.04.2024 | 45.1 | 46.9 | 44.5 |
© Bayerisches Landesamt für Umwelt 2024