
- Start >
- Rivers >
- Discharge >
- Regnitz >
- Hallerndorf >
- Chart of year

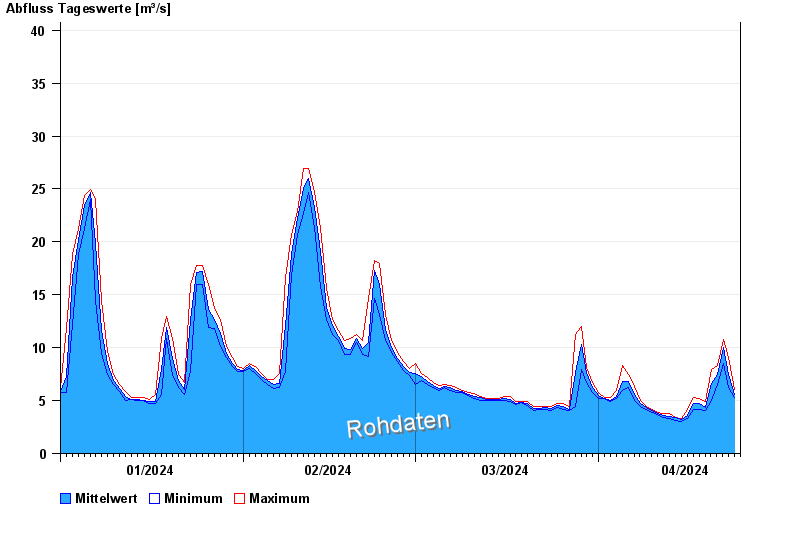
Chart of year Hallerndorf / Aisch
Discharge from 01.01.2024 to 24.04.2024
- 10.07.2021 Abfluss: 226 m³/s
- 02.06.2013 Abfluss: 189 m³/s
- 09.01.2011 Abfluss: 174 m³/s
- 10.12.2010 Abfluss: 148 m³/s
- 06.01.2018 Abfluss: 77,4 m³/s
| Date | Mean value [m³/s] | Maximum [m³/s] | Minimum [m³/s] |
|---|---|---|---|
| 24.04.2024 | 5.77 | 6.06 | 5.45 |
| 23.04.2024 | 7.49 | 9.04 | 6.22 |
| 22.04.2024 | 10 | 10.8 | 8.53 |
| 21.04.2024 | 7.46 | 8.35 | 6.53 |
| 20.04.2024 | 6.65 | 7.98 | 5.02 |
| 19.04.2024 | 4.35 | 4.87 | 4.05 |
| 18.04.2024 | 4.72 | 5.16 | 4.18 |
© Bayerisches Landesamt für Umwelt 2024