
- Start >
- Rivers >
- Discharge >
- Regnitz >
- Frauenkreuz >
- Chart of year

Chart of year Frauenkreuz / Gründlach
Discharge from 01.01.2024 to 23.04.2024
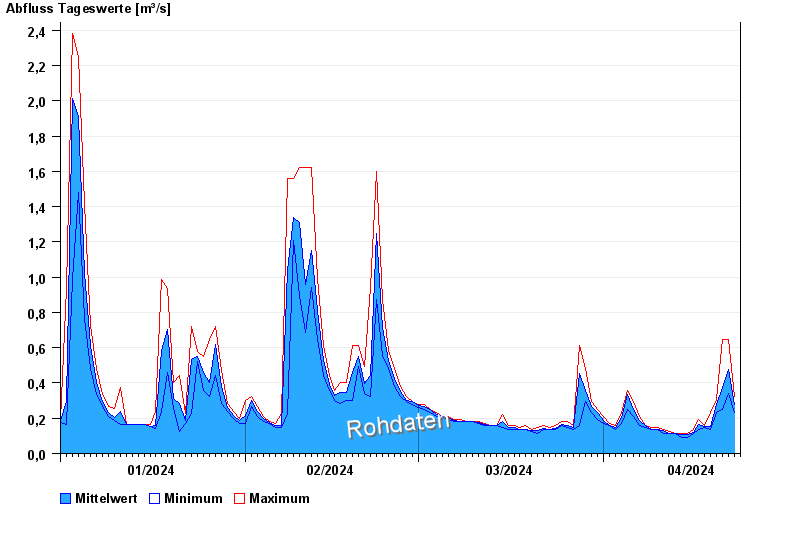
| Date | Mean value [m³/s] | Maximum [m³/s] | Minimum [m³/s] |
|---|---|---|---|
| 23.04.2024 | 0.282 | 0.325 | 0.234 |
| 22.04.2024 | 0.474 | 0.646 | 0.342 |
| 21.04.2024 | 0.374 | 0.646 | 0.249 |
| 20.04.2024 | 0.279 | 0.309 | 0.234 |
| 19.04.2024 | 0.151 | 0.234 | 0.134 |
| 18.04.2024 | 0.152 | 0.157 | 0.145 |
| 17.04.2024 | 0.162 | 0.194 | 0.134 |
© Bayerisches Landesamt für Umwelt 2024