
- Start >
- Rivers >
- Discharge >
- Regnitz >
- Emskirchen >
- Chart of year

Chart of year Emskirchen / Aurach
Discharge from 22.09.2019 to 21.09.2020
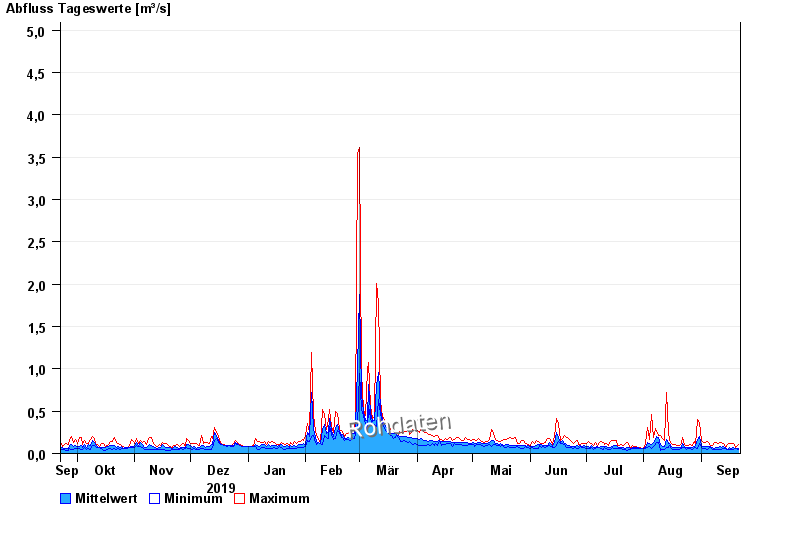
note
Wasserstand und Abfluss wird zeitweise durch Biberdamm beeinflusst.
- 21.12.1993 Abfluss: 27,7 m³/s
- 26.01.1995 Abfluss: 26,5 m³/s
- 21.03.2002 Abfluss: 26,2 m³/s
- 29.05.2007 Abfluss: 16,6 m³/s
- 02.03.1987 Abfluss: 15,4 m³/s
| Date | Mean value [m³/s] | Maximum [m³/s] | Minimum [m³/s] |
|---|---|---|---|
| 21.09.2020 | 0.059 | 0.104 | 0.042 |
| 20.09.2020 | 0.063 | 0.08 | 0.054 |
| 19.09.2020 | 0.064 | 0.076 | 0.054 |
| 18.09.2020 | 0.069 | 0.117 | 0.048 |
| 17.09.2020 | 0.061 | 0.117 | 0.048 |
| 16.09.2020 | 0.074 | 0.117 | 0.048 |
| 15.09.2020 | 0.053 | 0.107 | 0.045 |
© Bayerisches Landesamt für Umwelt 2024