
- Start >
- Rivers >
- Discharge >
- Regnitz >
- Emskirchen >
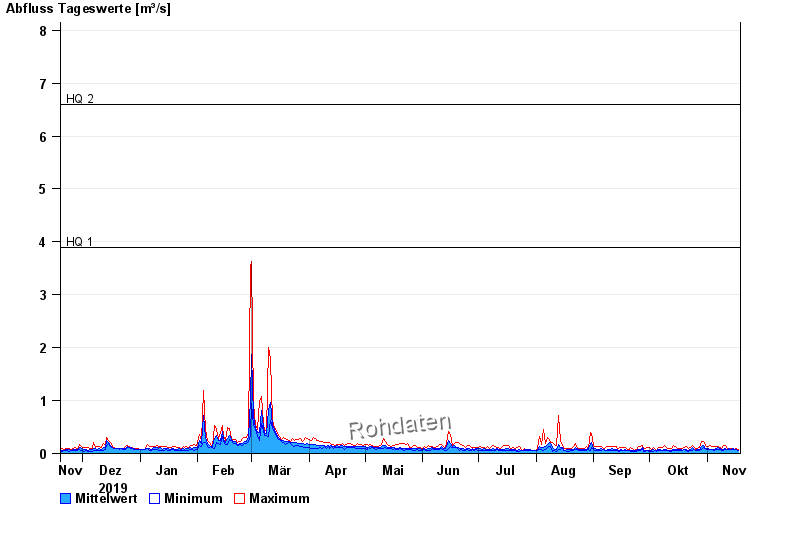
- Chart of year

Chart of year Emskirchen / Aurach
Discharge from 19.11.2019 to 18.11.2020
note
Wasserstand und Abfluss wird zeitweise durch Biberdamm beeinflusst.
- HQ1 3,9 m³/s
- HQ2 6,6 m³/s
- HQ5 9,2 m³/s
- HQ10 13,4 m³/s
- HQ20 18,7 m³/s
- HQ50 28,9 m³/s
- HQ100 39,6 m³/s
| Date | Mean value [m³/s] | Maximum [m³/s] | Minimum [m³/s] |
|---|---|---|---|
| 18.11.2020 | 0.059 | 0.075 | 0.053 |
| 17.11.2020 | 0.08 | 0.087 | 0.075 |
| 16.11.2020 | 0.082 | 0.083 | 0.079 |
| 15.11.2020 | 0.089 | 0.1 | 0.082 |
| 14.11.2020 | 0.085 | 0.1 | 0.078 |
| 13.11.2020 | 0.086 | 0.1 | 0.078 |
| 12.11.2020 | 0.078 | 0.099 | 0.073 |
© Bayerisches Landesamt für Umwelt 2024