

Chart of year Büg / Schwabach
Discharge from 24.09.2022 to 23.09.2023
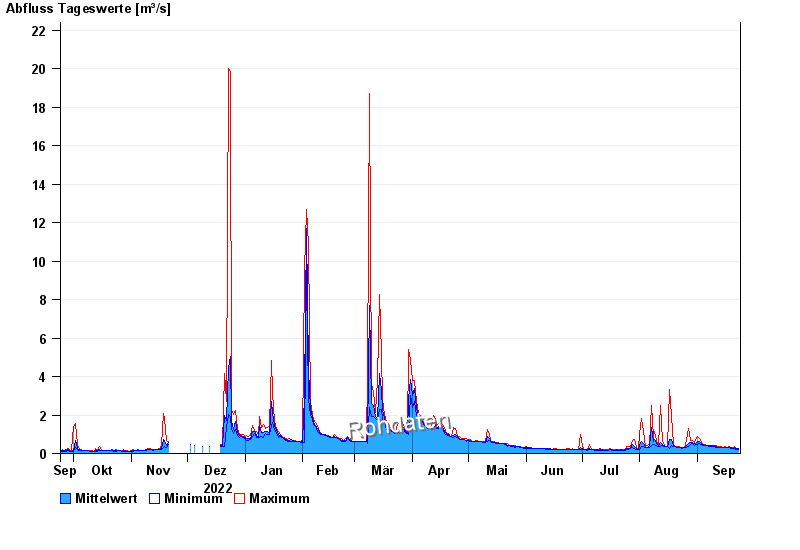
| Date | Mean value [m³/s] | Maximum [m³/s] | Minimum [m³/s] |
|---|---|---|---|
| 23.09.2023 | 0.239 | 0.249 | 0.218 |
| 22.09.2023 | 0.254 | 0.266 | 0.233 |
| 21.09.2023 | 0.301 | 0.338 | 0.278 |
| 20.09.2023 | 0.285 | 0.297 | 0.278 |
| 19.09.2023 | 0.298 | 0.317 | 0.278 |
| 18.09.2023 | 0.303 | 0.338 | 0.297 |
| 17.09.2023 | 0.302 | 0.317 | 0.297 |
© Bayerisches Landesamt für Umwelt 2024