

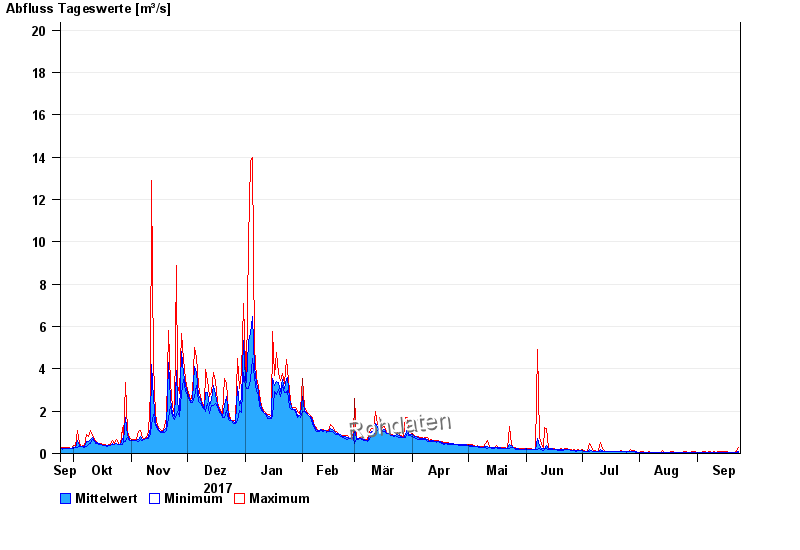
Chart of year Büg / Schwabach
Discharge from 24.09.2017 to 23.09.2018
- 20.07.2011 Abfluss: 48,5 m³/s
- 31.05.2013 Abfluss: 32,7 m³/s
- 23.12.2012 Abfluss: 31,3 m³/s
- 28.10.1998 Abfluss: 29,5 m³/s
- 26.01.1995 Abfluss: 29 m³/s
| Date | Mean value [m³/s] | Maximum [m³/s] | Minimum [m³/s] |
|---|---|---|---|
| 23.09.2018 | 0.101 | 0.306 | 0.052 |
| 22.09.2018 | 0.057 | 0.073 | 0.047 |
| 21.09.2018 | 0.052 | 0.056 | 0.047 |
| 20.09.2018 | 0.055 | 0.056 | 0.051 |
| 19.09.2018 | 0.052 | 0.066 | 0.047 |
| 18.09.2018 | 0.059 | 0.066 | 0.051 |
| 17.09.2018 | 0.057 | 0.071 | 0.046 |
© Bayerisches Landesamt für Umwelt 2024