

Chart of year Büg / Schwabach
Discharge from 21.08.2019 to 20.08.2020
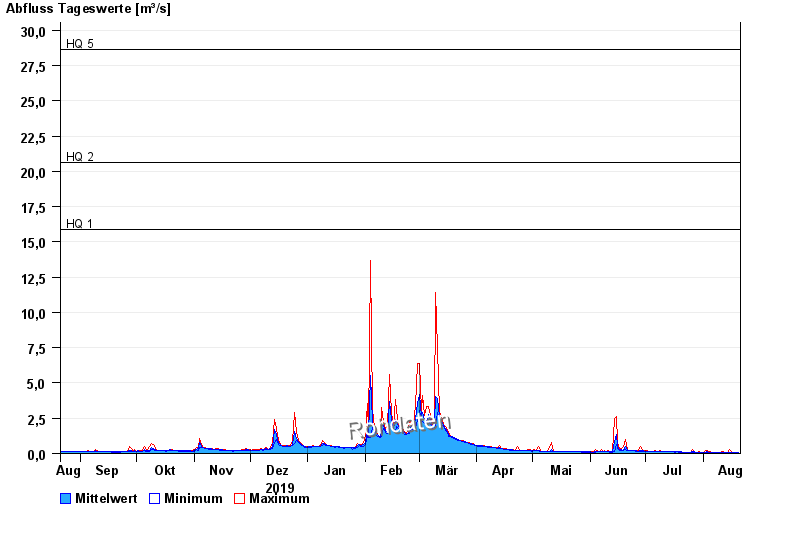
- HQ1 15,9 m³/s
- HQ2 20,6 m³/s
- HQ5 28,6 m³/s
- HQ10 34,6 m³/s
- HQ20 40,4 m³/s
- HQ50 48,5 m³/s
- HQ100 55 m³/s
| Date | Mean value [m³/s] | Maximum [m³/s] | Minimum [m³/s] |
|---|---|---|---|
| 20.08.2020 | 0.077 | 0.085 | 0.072 |
| 19.08.2020 | 0.08 | 0.085 | 0.072 |
| 18.08.2020 | 0.081 | 0.085 | 0.078 |
| 17.08.2020 | 0.08 | 0.084 | 0.078 |
| 16.08.2020 | 0.083 | 0.117 | 0.071 |
| 15.08.2020 | 0.092 | 0.317 | 0.066 |
| 14.08.2020 | 0.086 | 0.092 | 0.084 |
© Bayerisches Landesamt für Umwelt 2024