

Chart of year Büg / Schwabach
Discharge from 01.01.2019 to 31.12.2019
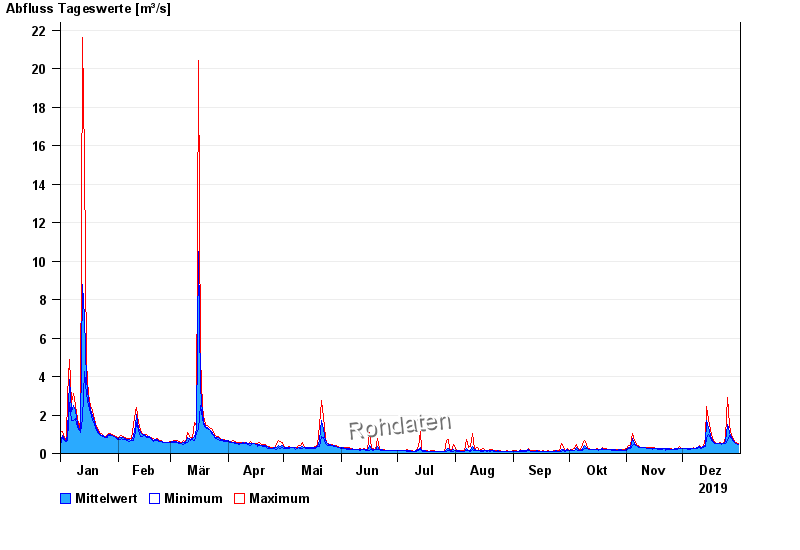
| Date | Mean value [m³/s] | Maximum [m³/s] | Minimum [m³/s] |
|---|---|---|---|
| 31.12.2019 | 0.492 | 0.517 | 0.458 |
| 30.12.2019 | 0.534 | 0.548 | 0.515 |
| 29.12.2019 | 0.593 | 0.616 | 0.546 |
| 28.12.2019 | 0.701 | 0.776 | 0.615 |
| 27.12.2019 | 0.831 | 0.919 | 0.776 |
| 26.12.2019 | 1.07 | 1.48 | 0.914 |
| 25.12.2019 | 1.53 | 2.89 | 0.688 |
© Bayerisches Landesamt für Umwelt 2024