

Chart of year Büg / Schwabach
Discharge from 20.11.2018 to 19.11.2019
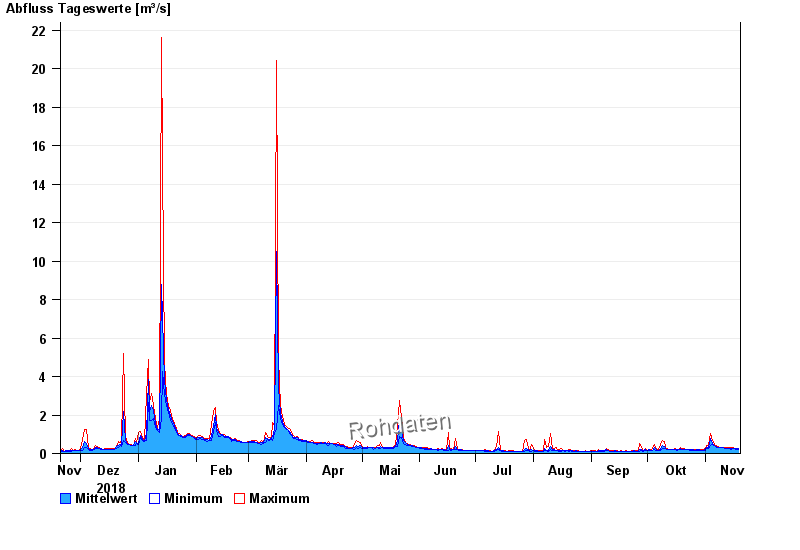
| Date | Mean value [m³/s] | Maximum [m³/s] | Minimum [m³/s] |
|---|---|---|---|
| 19.11.2019 | 0.243 | 0.243 | 0.227 |
| 18.11.2019 | 0.243 | 0.259 | 0.226 |
| 17.11.2019 | 0.246 | 0.259 | 0.241 |
| 16.11.2019 | 0.26 | 0.295 | 0.241 |
| 15.11.2019 | 0.265 | 0.314 | 0.224 |
| 14.11.2019 | 0.282 | 0.334 | 0.256 |
| 13.11.2019 | 0.268 | 0.334 | 0.255 |
© Bayerisches Landesamt für Umwelt 2024