

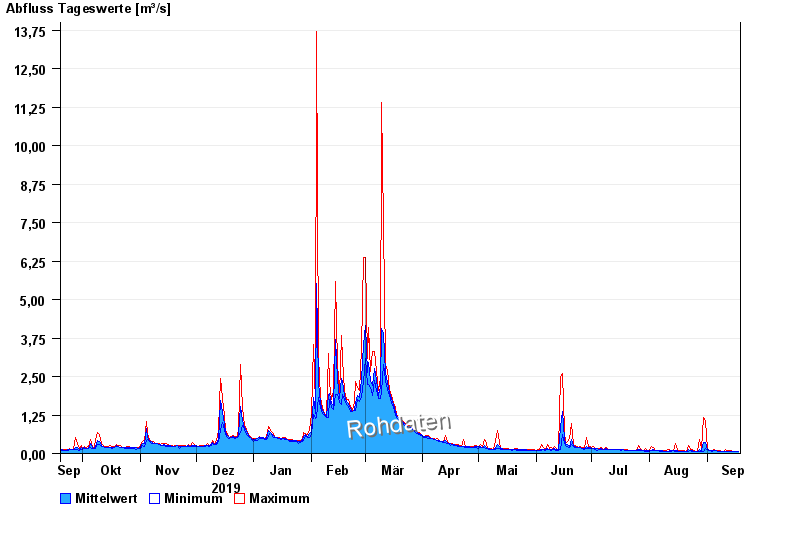
Chart of year Büg / Schwabach
Discharge from 19.09.2019 to 18.09.2020
| Date | Mean value [m³/s] | Maximum [m³/s] | Minimum [m³/s] |
|---|---|---|---|
| 18.09.2020 | 0.06 | 0.066 | 0.054 |
| 17.09.2020 | 0.062 | 0.067 | 0.06 |
| 16.09.2020 | 0.063 | 0.067 | 0.061 |
| 15.09.2020 | 0.065 | 0.074 | 0.062 |
| 14.09.2020 | 0.068 | 0.097 | 0.063 |
| 13.09.2020 | 0.069 | 0.083 | 0.063 |
| 12.09.2020 | 0.075 | 0.084 | 0.064 |
© Bayerisches Landesamt für Umwelt 2024