

Chart of year Büg / Schwabach
Discharge from 24.10.2020 to 23.10.2021
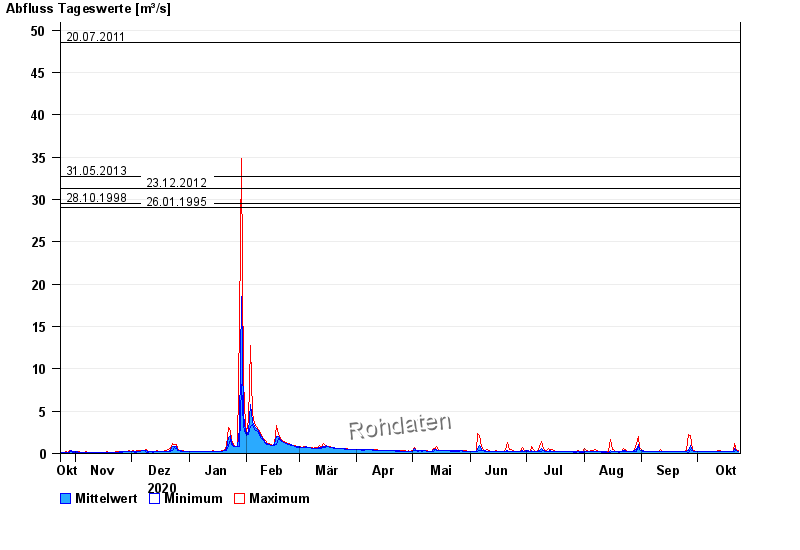
- 20.07.2011 Abfluss: 48,5 m³/s
- 31.05.2013 Abfluss: 32,7 m³/s
- 23.12.2012 Abfluss: 31,3 m³/s
- 28.10.1998 Abfluss: 29,5 m³/s
- 26.01.1995 Abfluss: 29 m³/s
| Date | Mean value [m³/s] | Maximum [m³/s] | Minimum [m³/s] |
|---|---|---|---|
| 23.10.2021 | 0.288 | 0.338 | 0.26 |
| 22.10.2021 | 0.342 | 0.385 | 0.296 |
| 21.10.2021 | 0.574 | 1.13 | 0.225 |
| 20.10.2021 | 0.222 | 0.275 | 0.21 |
| 19.10.2021 | 0.205 | 0.24 | 0.195 |
| 18.10.2021 | 0.196 | 0.209 | 0.195 |
| 17.10.2021 | 0.198 | 0.209 | 0.195 |
© Bayerisches Landesamt für Umwelt 2024