

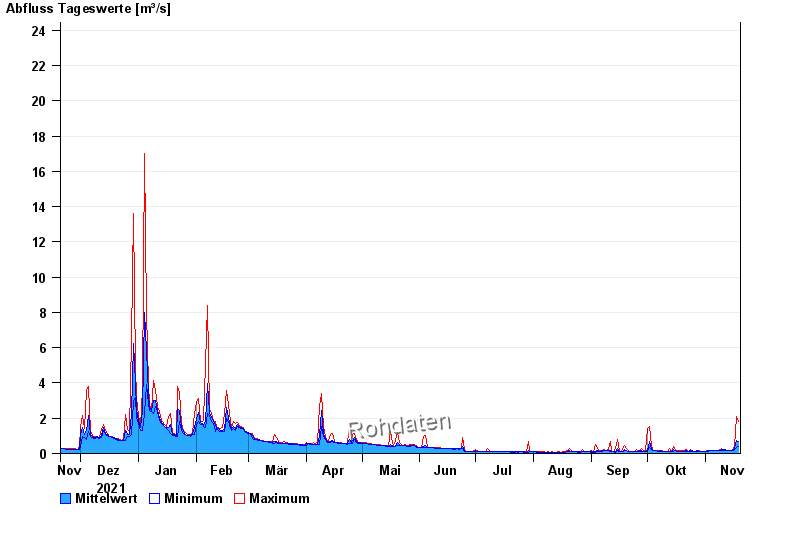
Chart of year Büg / Schwabach
Discharge from 20.11.2021 to 19.11.2022
- 20.07.2011 Abfluss: 48,5 m³/s
- 31.05.2013 Abfluss: 32,7 m³/s
- 23.12.2012 Abfluss: 31,3 m³/s
- 28.10.1998 Abfluss: 29,5 m³/s
- 26.01.1995 Abfluss: 29 m³/s
| Date | Mean value [m³/s] | Maximum [m³/s] | Minimum [m³/s] |
|---|---|---|---|
| 19.11.2022 | 0.67 | 1.81 | 0.388 |
| 18.11.2022 | 0.719 | 2.09 | 0.336 |
| 17.11.2022 | 0.267 | 0.417 | 0.214 |
| 16.11.2022 | 0.217 | 0.269 | 0.184 |
| 15.11.2022 | 0.184 | 0.184 | 0.184 |
| 14.11.2022 | 0.185 | 0.198 | 0.184 |
| 13.11.2022 | 0.183 | 0.198 | 0.17 |
© Bayerisches Landesamt für Umwelt 2024