

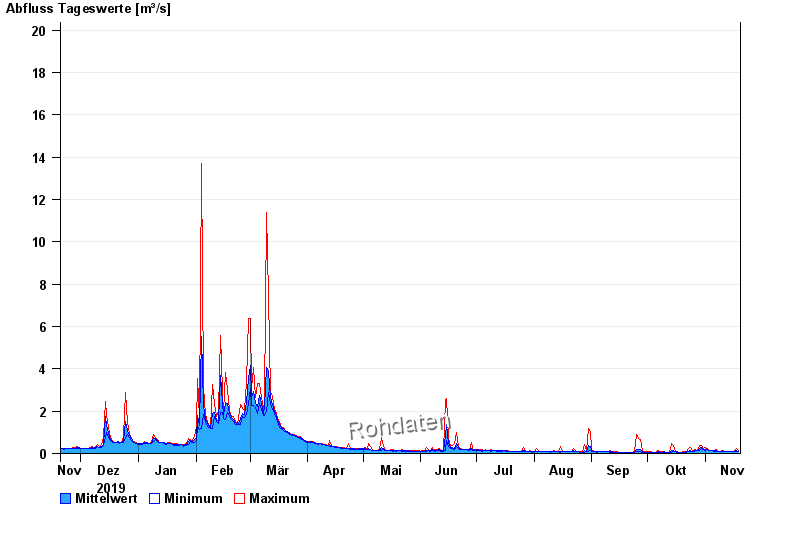
Chart of year Büg / Schwabach
Discharge from 20.11.2019 to 19.11.2020
- 20.07.2011 Abfluss: 48,5 m³/s
- 31.05.2013 Abfluss: 32,7 m³/s
- 23.12.2012 Abfluss: 31,3 m³/s
- 28.10.1998 Abfluss: 29,5 m³/s
- 26.01.1995 Abfluss: 29 m³/s
| Date | Mean value [m³/s] | Maximum [m³/s] | Minimum [m³/s] |
|---|---|---|---|
| 19.11.2020 | 0.115 | 0.126 | 0.1 |
| 18.11.2020 | 0.123 | 0.213 | 0.102 |
| 17.11.2020 | 0.114 | 0.143 | 0.103 |
| 16.11.2020 | 0.1 | 0.105 | 0.093 |
| 15.11.2020 | 0.088 | 0.096 | 0.075 |
| 14.11.2020 | 0.089 | 0.108 | 0.076 |
| 13.11.2020 | 0.087 | 0.097 | 0.078 |
© Bayerisches Landesamt für Umwelt 2024