

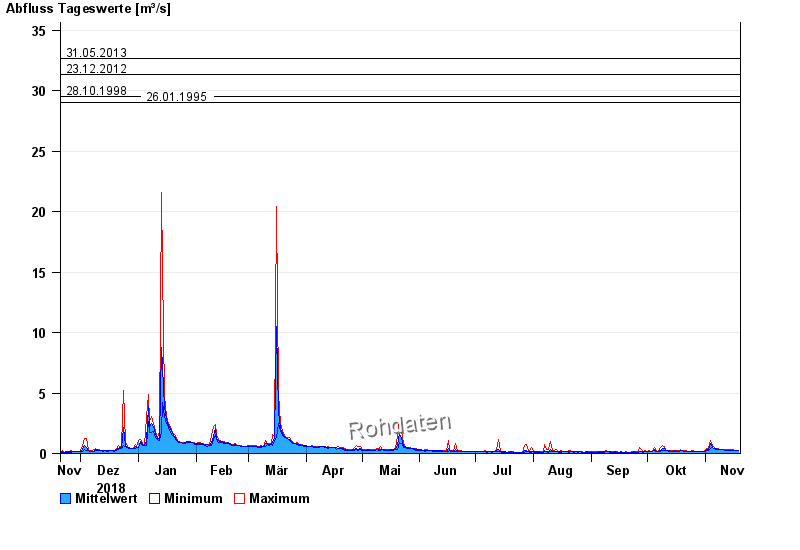
Chart of year Büg / Schwabach
Discharge from 20.11.2018 to 19.11.2019
- 20.07.2011 Abfluss: 48,5 m³/s
- 31.05.2013 Abfluss: 32,7 m³/s
- 23.12.2012 Abfluss: 31,3 m³/s
- 28.10.1998 Abfluss: 29,5 m³/s
- 26.01.1995 Abfluss: 29 m³/s
| Date | Mean value [m³/s] | Maximum [m³/s] | Minimum [m³/s] |
|---|---|---|---|
| 19.11.2019 | 0.243 | 0.243 | 0.227 |
| 18.11.2019 | 0.243 | 0.259 | 0.226 |
| 17.11.2019 | 0.246 | 0.259 | 0.241 |
| 16.11.2019 | 0.26 | 0.295 | 0.241 |
| 15.11.2019 | 0.265 | 0.314 | 0.224 |
| 14.11.2019 | 0.282 | 0.334 | 0.256 |
| 13.11.2019 | 0.268 | 0.334 | 0.255 |
© Bayerisches Landesamt für Umwelt 2024