

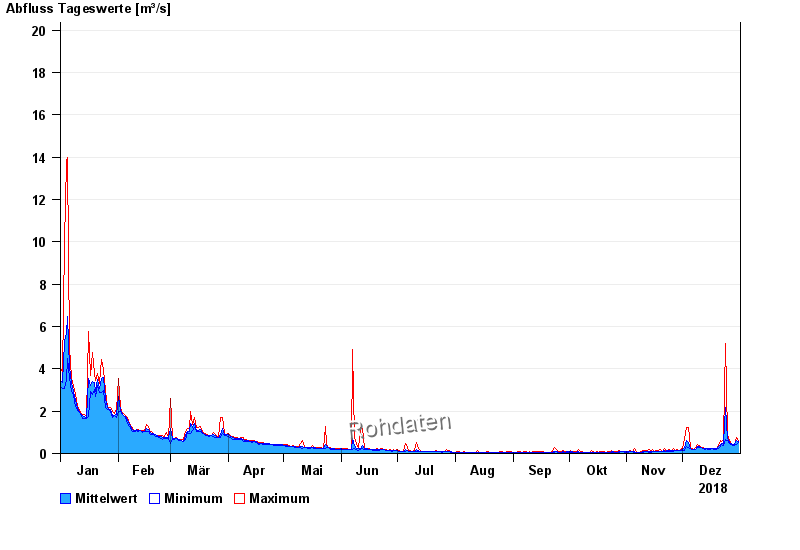
Chart of year Büg / Schwabach
Discharge from 01.01.2018 to 31.12.2018
- 20.07.2011 Abfluss: 48,5 m³/s
- 31.05.2013 Abfluss: 32,7 m³/s
- 23.12.2012 Abfluss: 31,3 m³/s
- 28.10.1998 Abfluss: 29,5 m³/s
- 26.01.1995 Abfluss: 29 m³/s
| Date | Mean value [m³/s] | Maximum [m³/s] | Minimum [m³/s] |
|---|---|---|---|
| 31.12.2018 | 0.553 | 0.577 | 0.513 |
| 30.12.2018 | 0.605 | 0.765 | 0.424 |
| 29.12.2018 | 0.41 | 0.424 | 0.396 |
| 28.12.2018 | 0.423 | 0.447 | 0.396 |
| 27.12.2018 | 0.463 | 0.473 | 0.445 |
| 26.12.2018 | 0.528 | 0.597 | 0.472 |
| 25.12.2018 | 0.69 | 0.886 | 0.596 |
© Bayerisches Landesamt für Umwelt 2024