

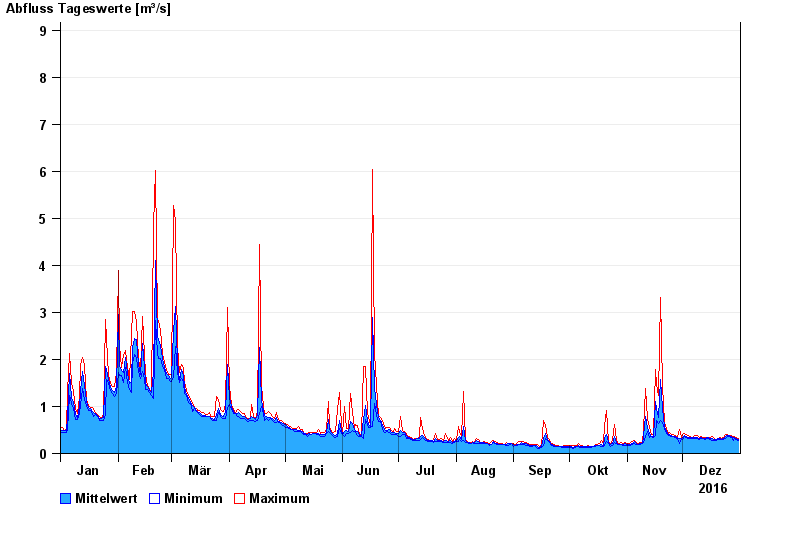
Chart of year Büg / Schwabach
Discharge from 01.01.2016 to 31.12.2016
- 20.07.2011 Abfluss: 48,5 m³/s
- 31.05.2013 Abfluss: 32,7 m³/s
- 23.12.2012 Abfluss: 31,3 m³/s
- 28.10.1998 Abfluss: 29,5 m³/s
- 26.01.1995 Abfluss: 29 m³/s
| Date | Mean value [m³/s] | Maximum [m³/s] | Minimum [m³/s] |
|---|---|---|---|
| 31.12.2016 | 0.307 | 0.322 | 0.282 |
| 30.12.2016 | 0.319 | 0.342 | 0.3 |
| 29.12.2016 | 0.347 | 0.363 | 0.319 |
| 28.12.2016 | 0.336 | 0.362 | 0.279 |
| 27.12.2016 | 0.355 | 0.383 | 0.338 |
| 26.12.2016 | 0.375 | 0.383 | 0.358 |
| 25.12.2016 | 0.377 | 0.406 | 0.357 |
© Bayerisches Landesamt für Umwelt 2024