

Chart of year Büg / Schwabach
Discharge from 20.11.2022 to 19.11.2023
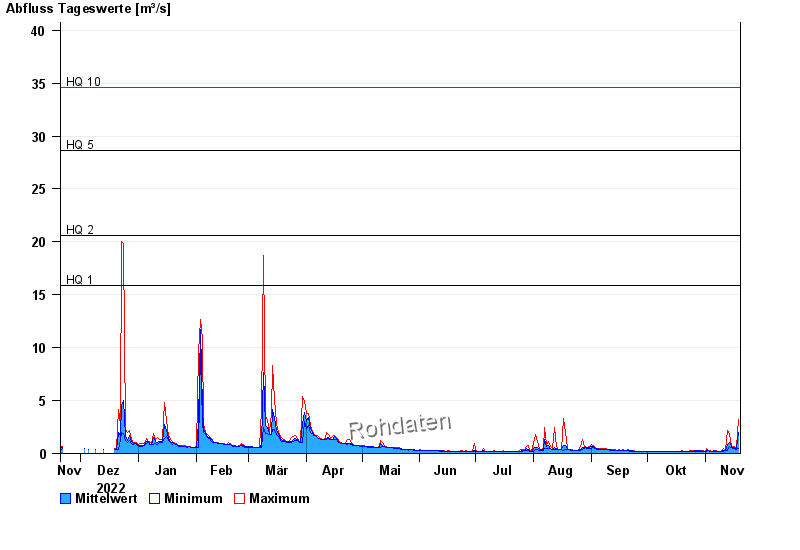
- HQ1 15,9 m³/s
- HQ2 20,6 m³/s
- HQ5 28,6 m³/s
- HQ10 34,6 m³/s
- HQ20 40,4 m³/s
- HQ50 48,5 m³/s
- HQ100 55 m³/s
| Date | Mean value [m³/s] | Maximum [m³/s] | Minimum [m³/s] |
|---|---|---|---|
| 19.11.2023 | 2.01 | 3.25 | 0.477 |
| 18.11.2023 | 0.469 | 0.54 | 0.42 |
| 17.11.2023 | 0.606 | 0.689 | 0.508 |
| 16.11.2023 | 0.581 | 0.646 | 0.508 |
| 15.11.2023 | 0.68 | 0.772 | 0.61 |
| 14.11.2023 | 1 | 1.82 | 0.689 |
| 13.11.2023 | 0.844 | 2.19 | 0.249 |
© Bayerisches Landesamt für Umwelt 2024