

Chart of year Büg / Schwabach
Discharge from 16.09.2019 to 15.09.2020
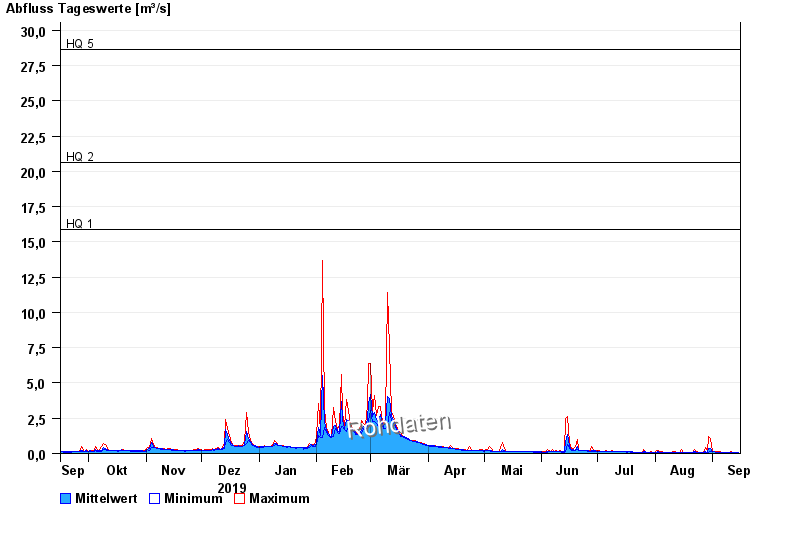
- HQ1 15,9 m³/s
- HQ2 20,6 m³/s
- HQ5 28,6 m³/s
- HQ10 34,6 m³/s
- HQ20 40,4 m³/s
- HQ50 48,5 m³/s
- HQ100 55 m³/s
| Date | Mean value [m³/s] | Maximum [m³/s] | Minimum [m³/s] |
|---|---|---|---|
| 15.09.2020 | 0.065 | 0.074 | 0.062 |
| 14.09.2020 | 0.068 | 0.097 | 0.063 |
| 13.09.2020 | 0.069 | 0.083 | 0.063 |
| 12.09.2020 | 0.075 | 0.084 | 0.064 |
| 11.09.2020 | 0.081 | 0.119 | 0.065 |
| 10.09.2020 | 0.078 | 0.079 | 0.072 |
| 09.09.2020 | 0.078 | 0.08 | 0.072 |
© Bayerisches Landesamt für Umwelt 2024