

Chart of year Bruckberg / Haselbach
Discharge from 01.01.2024 to 25.04.2024
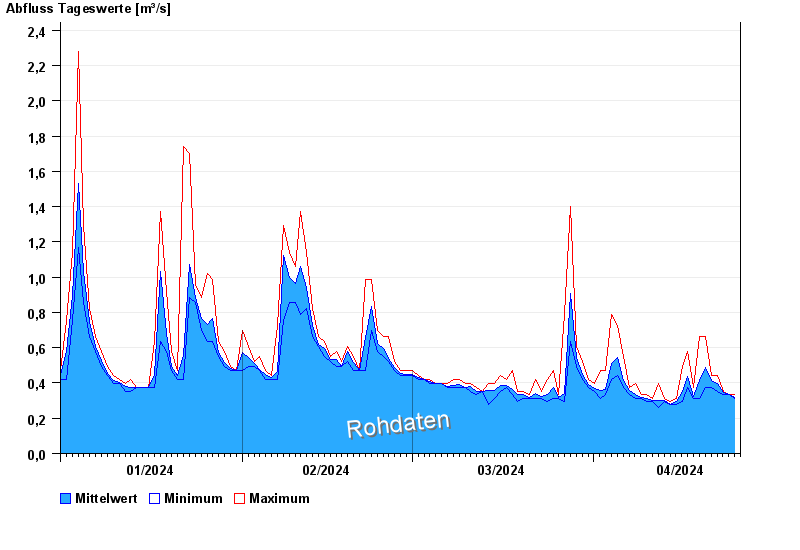
| Date | Mean value [m³/s] | Maximum [m³/s] | Minimum [m³/s] |
|---|---|---|---|
| 25.04.2024 | 0.318 | 0.333 | 0.313 |
| 24.04.2024 | 0.333 | 0.333 | 0.333 |
| 23.04.2024 | 0.348 | 0.354 | 0.333 |
| 22.04.2024 | 0.396 | 0.444 | 0.354 |
| 21.04.2024 | 0.412 | 0.444 | 0.375 |
| 20.04.2024 | 0.49 | 0.664 | 0.375 |
| 19.04.2024 | 0.416 | 0.664 | 0.313 |
© Bayerisches Landesamt für Umwelt 2024