

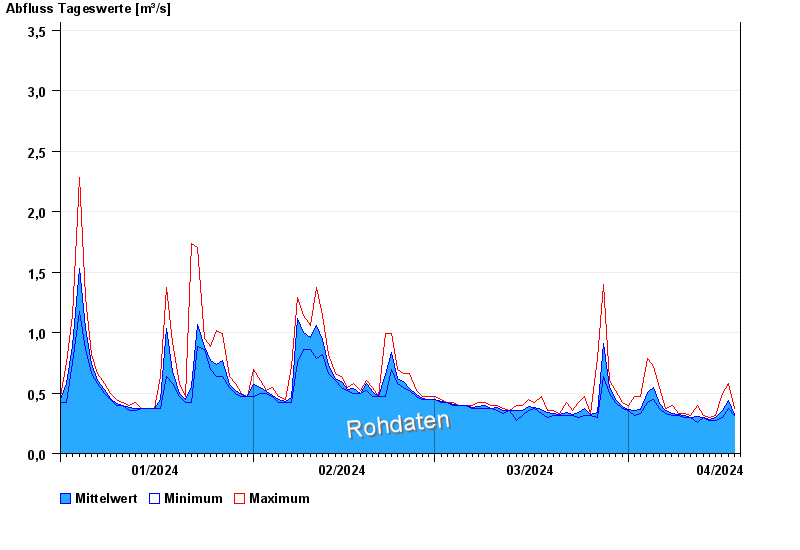
Chart of year Bruckberg / Haselbach
Discharge from 01.01.2024 to 18.04.2024
- 08.01.2011 Abfluss: 14,3 m³/s
- 22.01.2012 Abfluss: 13,9 m³/s
- 21.12.1993 Abfluss: 12,7 m³/s
- 13.01.2011 Abfluss: 12,1 m³/s
- 13.04.1994 Abfluss: 12 m³/s
| Date | Mean value [m³/s] | Maximum [m³/s] | Minimum [m³/s] |
|---|---|---|---|
| 18.04.2024 | 0.333 | 0.375 | 0.313 |
| 17.04.2024 | 0.436 | 0.576 | 0.375 |
| 16.04.2024 | 0.353 | 0.495 | 0.294 |
| 15.04.2024 | 0.296 | 0.313 | 0.276 |
| 14.04.2024 | 0.28 | 0.294 | 0.276 |
| 13.04.2024 | 0.301 | 0.313 | 0.294 |
| 12.04.2024 | 0.302 | 0.397 | 0.258 |
© Bayerisches Landesamt für Umwelt 2024