
- Start >
- Rivers >
- Discharge >
- Regnitz >
- Beilngries oberh. der Sulz >
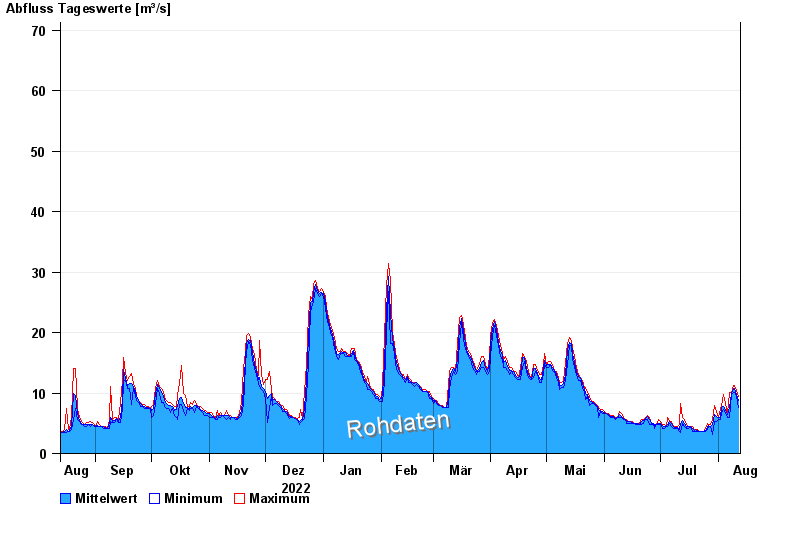
- Chart of year

Chart of year Beilngries oberh. der Sulz / Altmühl
Discharge from 13.08.2022 to 12.08.2023
 Für diesen Pegel sind keine Jährlichkeiten hinterlegt.
| Date | Mean value [m³/s] | Maximum [m³/s] | Minimum [m³/s] |
|---|---|---|---|
| 12.08.2023 | 8.72 | 9.38 | 7.57 |
| 11.08.2023 | 9.79 | 10.5 | 9.38 |
| 10.08.2023 | 10.8 | 11.3 | 10.1 |
| 09.08.2023 | 10.8 | 11.3 | 10.1 |
| 08.08.2023 | 9.88 | 10.1 | 9.74 |
| 07.08.2023 | 7.54 | 10.1 | 5.95 |
| 06.08.2023 | 6.37 | 6.6 | 5.95 |
© Bayerisches Landesamt für Umwelt 2024