

Chart of total period Aha / Altmühl
Discharge from 01.11.1975 to 19.04.2024
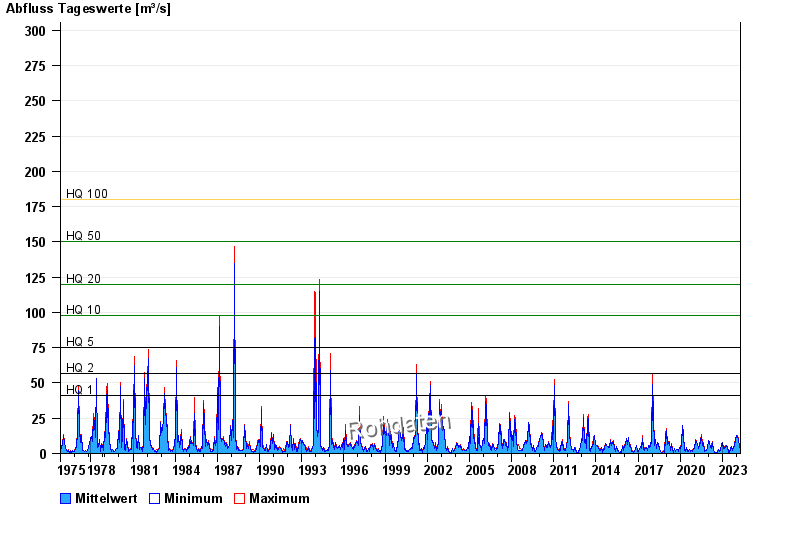
- HQ1 41 m³/s
- HQ2 57 m³/s
- HQ5 75 m³/s
- HQ10 98 m³/s
- HQ20 120 m³/s
- HQ50 150 m³/s
- HQ100 180 m³/s
| Date | Mean value [m³/s] | Maximum [m³/s] | Minimum [m³/s] |
|---|---|---|---|
| 19.04.2024 | 2.02 | 2.21 | 1.95 |
| 18.04.2024 | 1.92 | 2 | 1.83 |
| 17.04.2024 | 1.72 | 1.83 | 1.64 |
| 16.04.2024 | 1.55 | 1.64 | 1.52 |
| 15.04.2024 | 1.53 | 1.6 | 1.41 |
| 14.04.2024 | 1.45 | 1.52 | 1.41 |
| 13.04.2024 | 1.57 | 1.64 | 1.52 |
© Bayerisches Landesamt für Umwelt 2024