

Chart of total period Achsheim / Schmutter
Discharge from 01.11.1966 to 18.04.2024
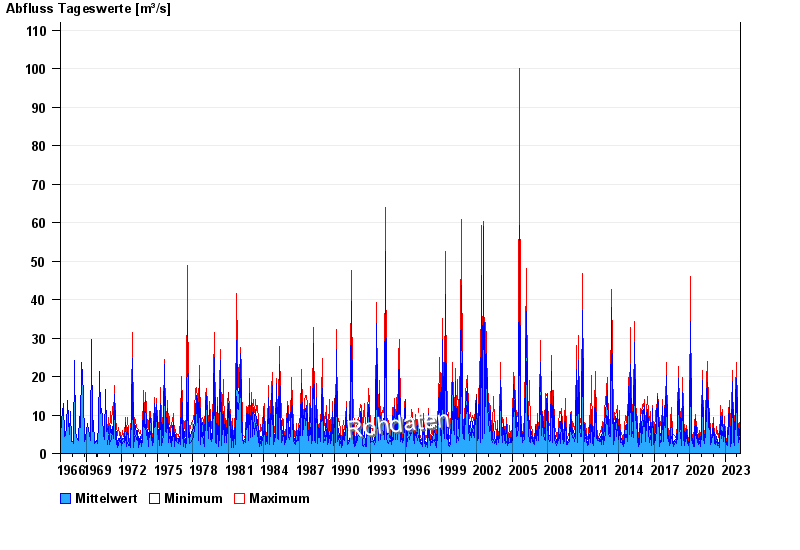
| Date | Mean value [m³/s] | Maximum [m³/s] | Minimum [m³/s] |
|---|---|---|---|
| 18.04.2024 | 3.01 | 3.84 | 2.64 |
| 17.04.2024 | 2.82 | 3.62 | 2.3 |
| 16.04.2024 | 2.73 | 3.41 | 2.14 |
| 15.04.2024 | 2.33 | 3.41 | 1.83 |
| 14.04.2024 | 1.99 | 2.14 | 1.83 |
| 13.04.2024 | 2.08 | 2.46 | 1.83 |
| 12.04.2024 | 2.08 | 2.46 | 1.55 |
© Bayerisches Landesamt für Umwelt 2024