
- Start >
- Rivers >
- Discharge >
- Untere Donau >
- Taferlruck >
- Chart of total period

Chart of total period Taferlruck / Große Ohe
Discharge from 01.11.1977 to 25.04.2024
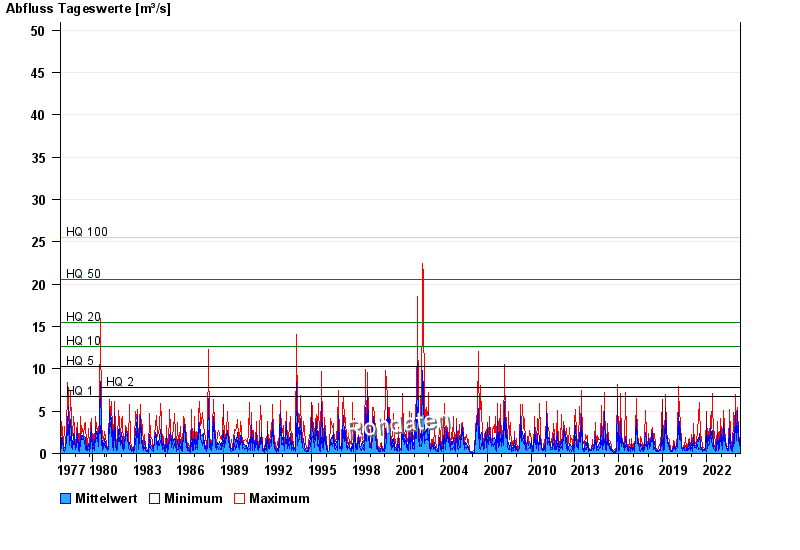
- HQ1 6,79 m³/s
- HQ2 7,8 m³/s
- HQ5 10,3 m³/s
- HQ10 12,6 m³/s
- HQ20 15,5 m³/s
- HQ50 20,6 m³/s
- HQ100 25,5 m³/s
| Date | Mean value [m³/s] | Maximum [m³/s] | Minimum [m³/s] |
|---|---|---|---|
| 25.04.2024 | 0.58 | 0.598 | 0.556 |
| 24.04.2024 | 0.583 | 0.598 | 0.577 |
| 23.04.2024 | 0.596 | 0.643 | 0.577 |
| 22.04.2024 | 0.644 | 0.665 | 0.62 |
| 21.04.2024 | 0.757 | 1.06 | 0.665 |
| 20.04.2024 | 1.03 | 1.58 | 0.713 |
| 19.04.2024 | 0.638 | 0.713 | 0.598 |
© Bayerisches Landesamt für Umwelt 2024