
- Start >
- Rivers >
- Discharge >
- Untere Donau >
- Staudach >
- Chart of total period

Chart of total period Staudach / Tiroler Achen
Discharge from 01.11.1920 to 20.04.2024
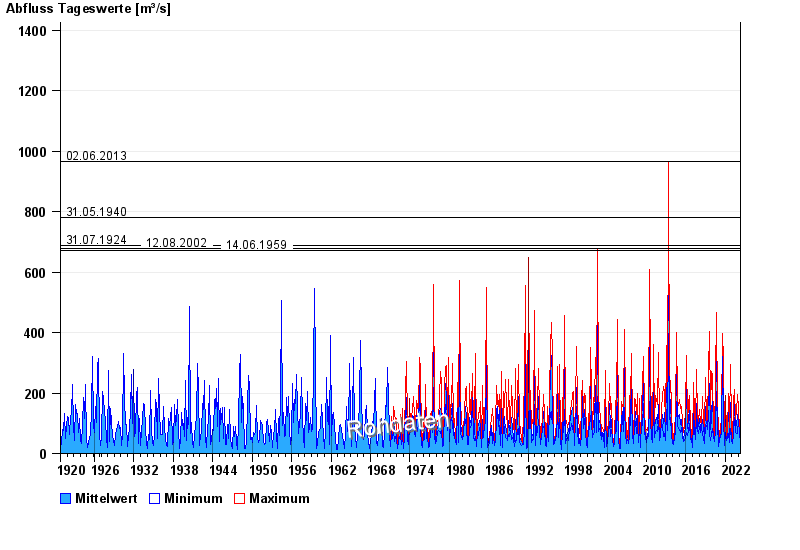
- 02.06.2013 Abfluss: 966 m³/s
- 31.05.1940 Abfluss: 780 m³/s
- 31.07.1924 Abfluss: 687 m³/s
- 12.08.2002 Abfluss: 678 m³/s
- 14.06.1959 Abfluss: 671 m³/s
| Date | Mean value [m³/s] | Maximum [m³/s] | Minimum [m³/s] |
|---|---|---|---|
| 20.04.2024 | 40.4 | 42.1 | 38.9 |
| 19.04.2024 | 34.3 | 38.1 | 32.9 |
| 18.04.2024 | 36.9 | 39.7 | 35.9 |
| 17.04.2024 | 39 | 42.1 | 38.1 |
| 16.04.2024 | 49.9 | 64.7 | 42.1 |
| 15.04.2024 | 37.2 | 42.1 | 35.1 |
| 14.04.2024 | 35.5 | 40.5 | 32.9 |
© Bayerisches Landesamt für Umwelt 2024