
- Start >
- Rivers >
- Discharge >
- Untere Donau >
- Seebruck >
- Chart of year

Chart of year Seebruck / Alz
Discharge from 01.01.2024 to 25.04.2024
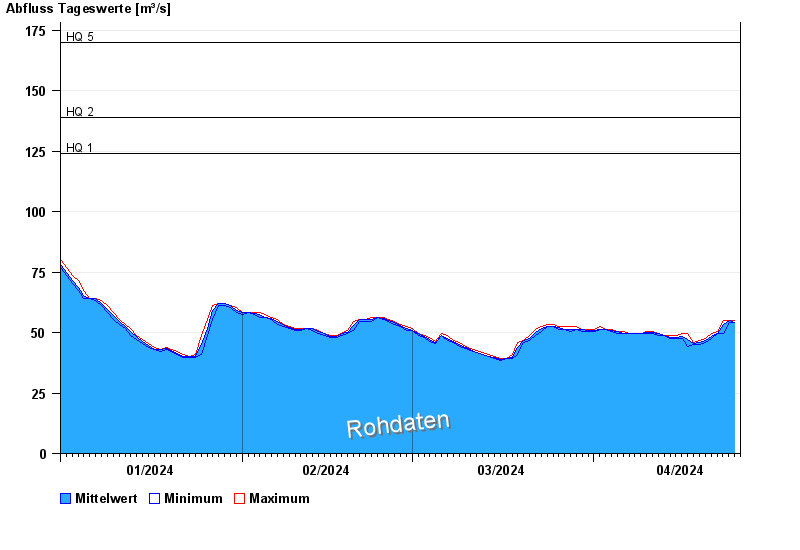
- HQ1 124 m³/s
- HQ2 139 m³/s
- HQ5 170 m³/s
- HQ10 200 m³/s
- HQ20 230 m³/s
- HQ50 270 m³/s
- HQ100 300 m³/s
| Date | Mean value [m³/s] | Maximum [m³/s] | Minimum [m³/s] |
|---|---|---|---|
| 25.04.2024 | 54.4 | 55.1 | 54.1 |
| 24.04.2024 | 55 | 55.1 | 54.1 |
| 23.04.2024 | 53.2 | 55.1 | 49.5 |
| 22.04.2024 | 49.8 | 50.4 | 49.5 |
| 21.04.2024 | 48.4 | 49.5 | 47.7 |
| 20.04.2024 | 46.9 | 47.7 | 45.9 |
| 19.04.2024 | 45.9 | 46.8 | 45 |
© Bayerisches Landesamt für Umwelt 2024