
- Start >
- Rivers >
- Discharge >
- Untere Donau >
- Salching >
- Chart of year

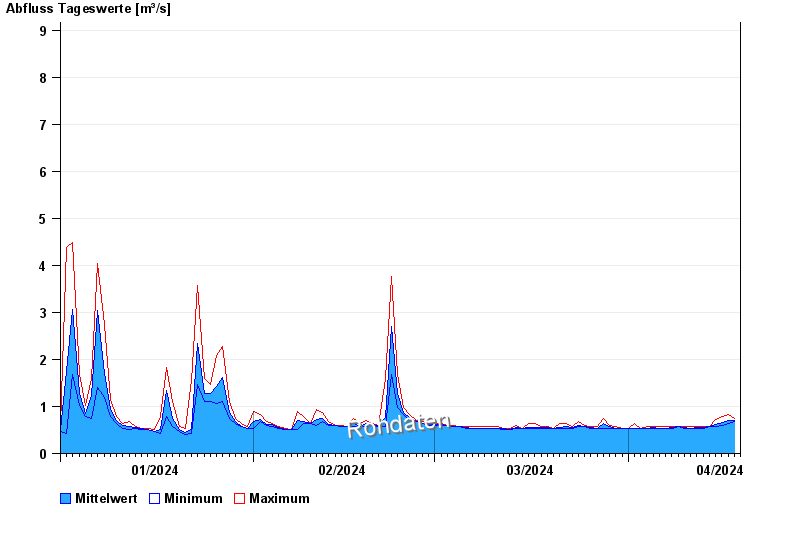
Chart of year Salching / Aiterach
Discharge from 01.01.2024 to 18.04.2024
- HQ1 10 m³/s
- HQ2 16 m³/s
- HQ5 23 m³/s
- HQ10 28 m³/s
- HQ20 33 m³/s
- HQ50 40 m³/s
- HQ100 45 m³/s
| Date | Mean value [m³/s] | Maximum [m³/s] | Minimum [m³/s] |
|---|---|---|---|
| 18.04.2024 | 0.715 | 0.751 | 0.675 |
| 17.04.2024 | 0.702 | 0.83 | 0.638 |
| 16.04.2024 | 0.653 | 0.79 | 0.602 |
| 15.04.2024 | 0.609 | 0.713 | 0.566 |
| 14.04.2024 | 0.566 | 0.566 | 0.566 |
| 13.04.2024 | 0.558 | 0.566 | 0.531 |
| 12.04.2024 | 0.547 | 0.566 | 0.531 |
© Bayerisches Landesamt für Umwelt 2024