
- Start >
- Rivers >
- Discharge >
- Untere Donau >
- Postmünster >
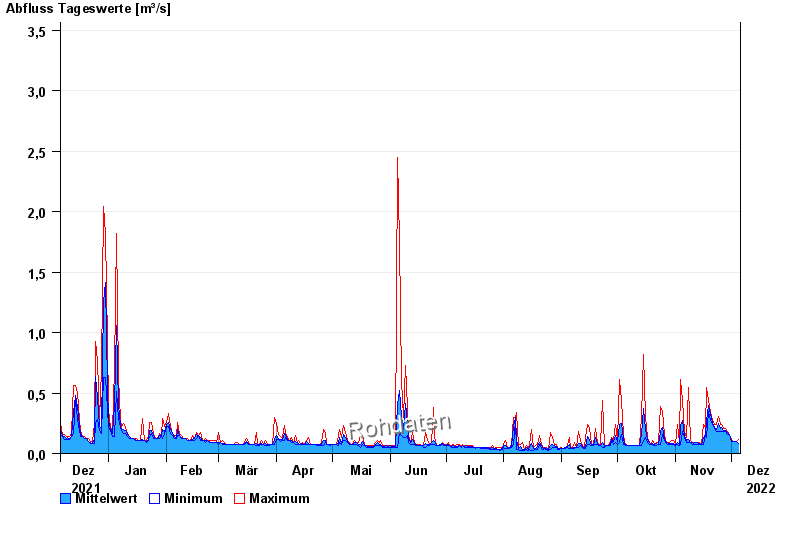
- Chart of year

Chart of year Postmünster / Gambach
Discharge from 06.12.2021 to 05.12.2022
- 02.08.1991 Abfluss: 18,2 m³/s
- 12.06.1990 Abfluss: 16,9 m³/s
- 13.01.2004 Abfluss: 15,8 m³/s
- 01.08.1991 Abfluss: 13,4 m³/s
- 02.06.1995 Abfluss: 13,1 m³/s
| Date | Mean value [m³/s] | Maximum [m³/s] | Minimum [m³/s] |
|---|---|---|---|
| 05.12.2022 | 0.086 | 0.113 | 0.081 |
| 04.12.2022 | 0.096 | 0.096 | 0.096 |
| 03.12.2022 | 0.096 | 0.096 | 0.096 |
| 02.12.2022 | 0.096 | 0.096 | 0.096 |
| 01.12.2022 | 0.098 | 0.113 | 0.096 |
| 30.11.2022 | 0.154 | 0.154 | 0.154 |
| 29.11.2022 | 0.176 | 0.179 | 0.154 |
© Bayerisches Landesamt für Umwelt 2024