
- Start >
- Rivers >
- Discharge >
- Untere Donau >
- Postmünster >
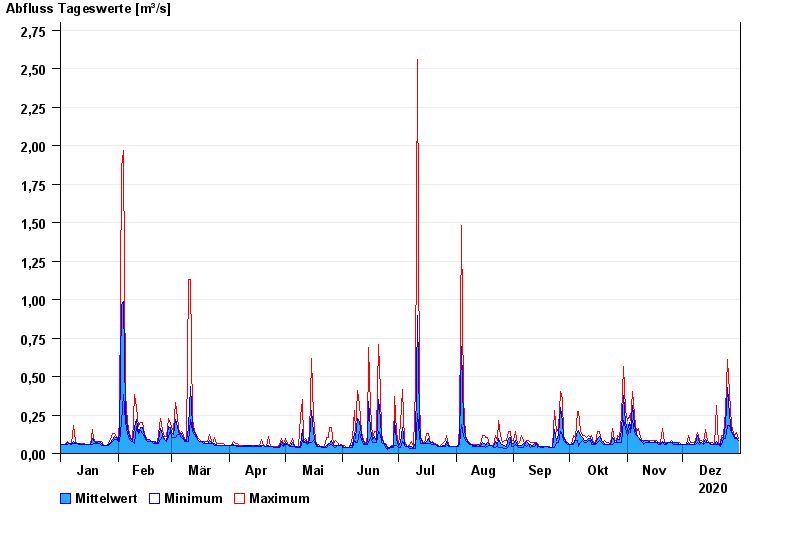
- Chart of year

Chart of year Postmünster / Gambach
Discharge from 01.01.2020 to 31.12.2020
| Date | Mean value [m³/s] | Maximum [m³/s] | Minimum [m³/s] |
|---|---|---|---|
| 31.12.2020 | 0.084 | 0.098 | 0.082 |
| 30.12.2020 | 0.102 | 0.135 | 0.098 |
| 29.12.2020 | 0.113 | 0.115 | 0.098 |
| 28.12.2020 | 0.117 | 0.135 | 0.115 |
| 27.12.2020 | 0.144 | 0.182 | 0.135 |
| 26.12.2020 | 0.244 | 0.395 | 0.182 |
| 25.12.2020 | 0.427 | 0.613 | 0.182 |
© Bayerisches Landesamt für Umwelt 2024