
- Start >
- Rivers >
- Discharge >
- Untere Donau >
- Postmünster >
- Chart of total period

Chart of total period Postmünster / Gambach
Discharge from 01.11.1972 to 24.04.2024
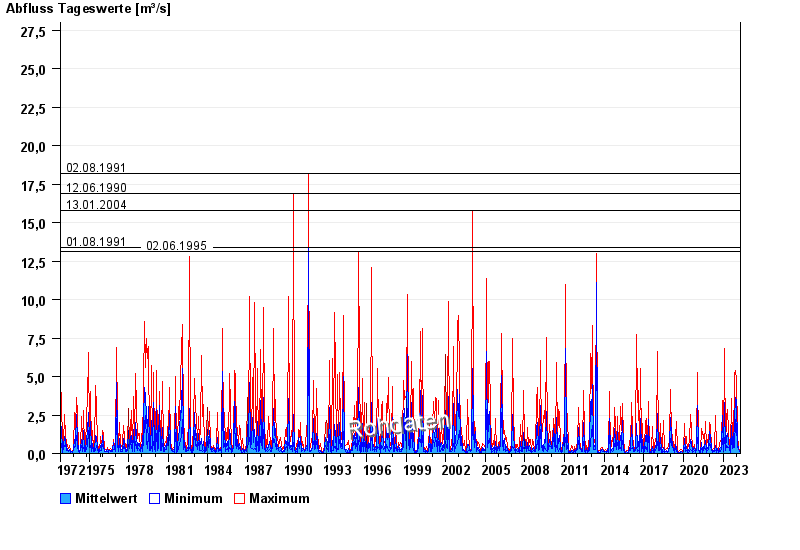
- 02.08.1991 Abfluss: 18,2 m³/s
- 12.06.1990 Abfluss: 16,9 m³/s
- 13.01.2004 Abfluss: 15,8 m³/s
- 01.08.1991 Abfluss: 13,4 m³/s
- 02.06.1995 Abfluss: 13,1 m³/s
| Date | Mean value [m³/s] | Maximum [m³/s] | Minimum [m³/s] |
|---|---|---|---|
| 24.04.2024 | 0.096 | 0.109 | 0.093 |
| 23.04.2024 | 0.097 | 0.109 | 0.093 |
| 22.04.2024 | 0.111 | 0.128 | 0.093 |
| 21.04.2024 | 0.118 | 0.15 | 0.109 |
| 20.04.2024 | 0.113 | 0.128 | 0.109 |
| 19.04.2024 | 0.096 | 0.109 | 0.093 |
| 18.04.2024 | 0.108 | 0.128 | 0.093 |
© Bayerisches Landesamt für Umwelt 2024