
- Start >
- Rivers >
- Discharge >
- Untere Donau >
- Pfelling >
- Chart of total period

Chart of total period Pfelling / Donau
Discharge from 01.11.1925 to 25.04.2024
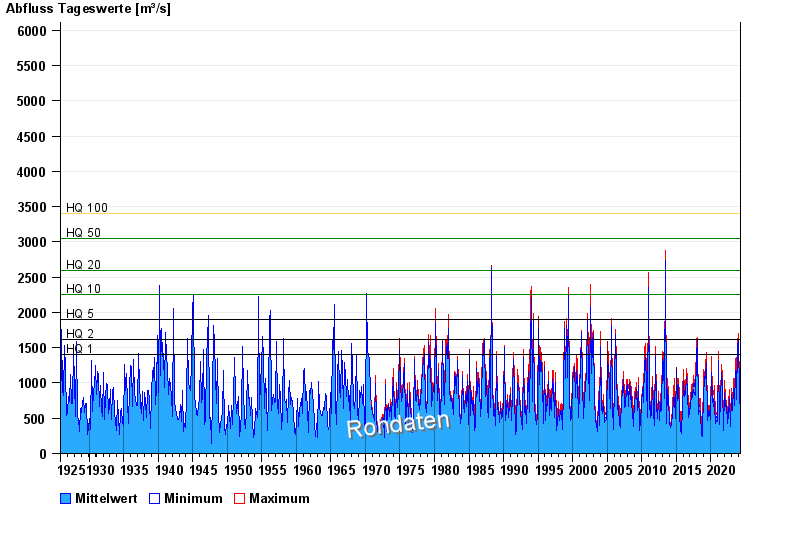
- HQ1 1400 m³/s
- HQ2 1620 m³/s
- HQ5 1900 m³/s
- HQ10 2250 m³/s
- HQ20 2600 m³/s
- HQ50 3050 m³/s
- HQ100 3400 m³/s
| Date | Mean value [m³/s] | Maximum [m³/s] | Minimum [m³/s] |
|---|---|---|---|
| 25.04.2024 | 481 | 492 | 465 |
| 24.04.2024 | 508 | 542 | 468 |
| 23.04.2024 | 574 | 592 | 542 |
| 22.04.2024 | 598 | 614 | 589 |
| 21.04.2024 | 605 | 642 | 563 |
| 20.04.2024 | 547 | 563 | 534 |
| 19.04.2024 | 550 | 560 | 534 |
© Bayerisches Landesamt für Umwelt 2024