
- Start >
- Rivers >
- Discharge >
- Untere Donau >
- Parsberg >
- Chart of total period

Chart of total period Parsberg / Schwarze Laber
Discharge from 01.11.1960 to 25.04.2024
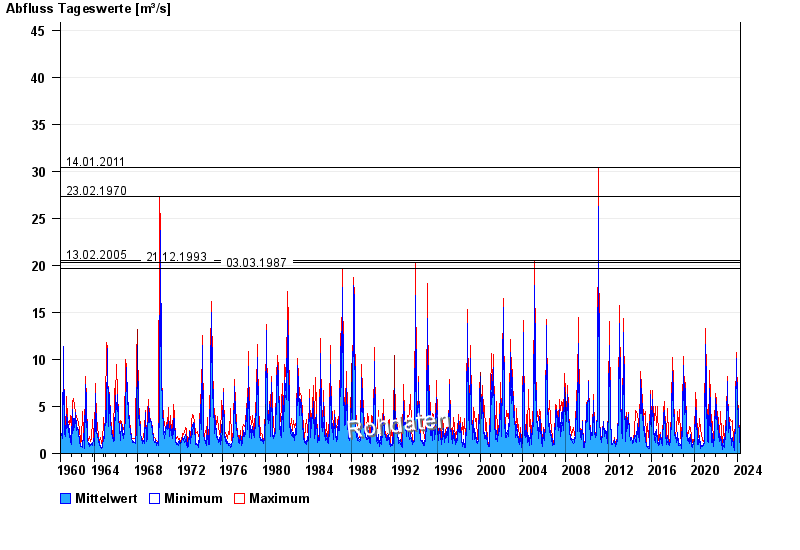
- 14.01.2011 Abfluss: 30,4 m³/s
- 23.02.1970 Abfluss: 27,3 m³/s
- 13.02.2005 Abfluss: 20,5 m³/s
- 21.12.1993 Abfluss: 20,3 m³/s
- 03.03.1987 Abfluss: 19,7 m³/s
| Date | Mean value [m³/s] | Maximum [m³/s] | Minimum [m³/s] |
|---|---|---|---|
| 25.04.2024 | 1.75 | 1.75 | 1.75 |
| 24.04.2024 | 1.93 | 2.41 | 1.66 |
| 23.04.2024 | 2.09 | 2.21 | 1.84 |
| 22.04.2024 | 2.25 | 2.41 | 2.12 |
| 21.04.2024 | 1.86 | 2.12 | 1.75 |
| 20.04.2024 | 1.88 | 2.41 | 1.48 |
| 19.04.2024 | 1.07 | 1.48 | 0.895 |
© Bayerisches Landesamt für Umwelt 2024