
- Start >
- Rivers >
- Discharge >
- Untere Donau >
- Münchshofen >
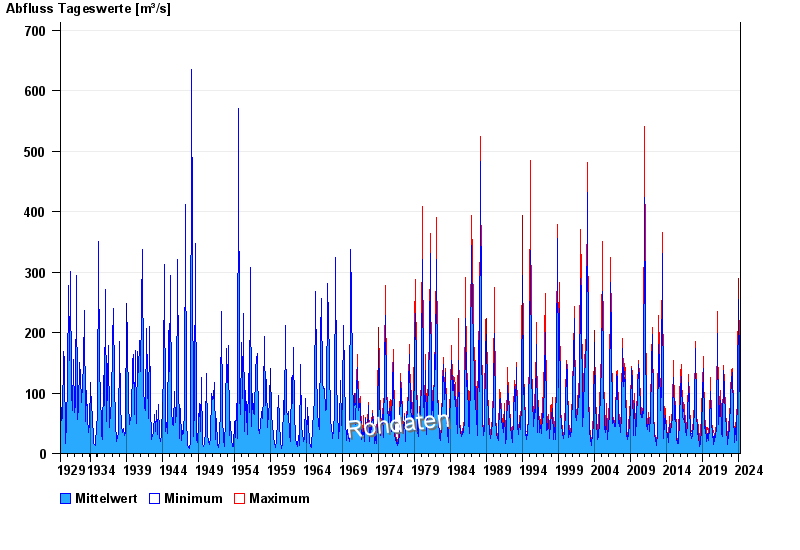
- Chart of total period

Chart of total period Münchshofen / Naab
Discharge from 01.11.1929 to 24.04.2024
| Date | Mean value [m³/s] | Maximum [m³/s] | Minimum [m³/s] |
|---|---|---|---|
| 24.04.2024 | 61.8 | 63.9 | 60.6 |
| 23.04.2024 | 64.4 | 67.1 | 63 |
| 22.04.2024 | 69.6 | 73 | 65.5 |
| 21.04.2024 | 61.7 | 65.5 | 54.5 |
| 20.04.2024 | 46.4 | 53.7 | 40 |
| 19.04.2024 | 39.5 | 40 | 38.6 |
| 18.04.2024 | 38 | 39.3 | 36.5 |
© Bayerisches Landesamt für Umwelt 2024