
- Start >
- Rivers >
- Discharge >
- Untere Donau >
- Marienthal >
- Chart of year

Chart of year Marienthal / Regen
Discharge from 01.01.2024 to 25.04.2024
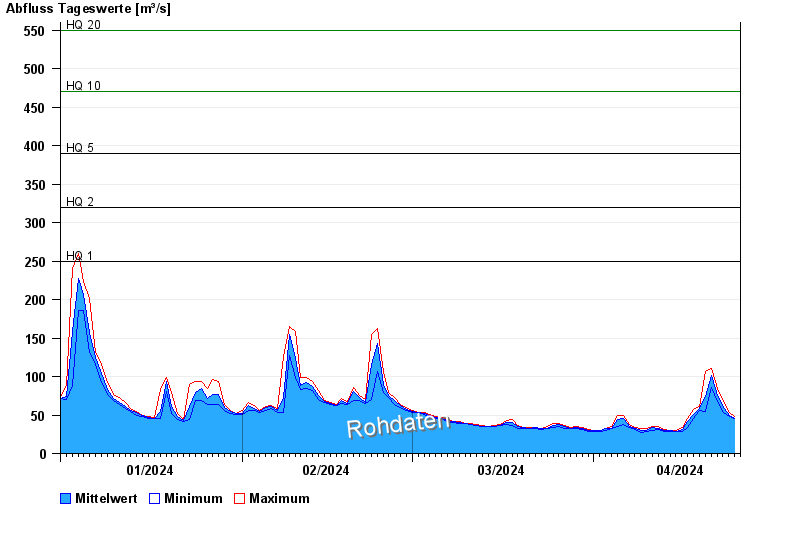
- HQ1 250 m³/s
- HQ2 320 m³/s
- HQ5 390 m³/s
- HQ10 470 m³/s
- HQ20 550 m³/s
- HQ50 660 m³/s
- HQ100 750 m³/s
| Date | Mean value [m³/s] | Maximum [m³/s] | Minimum [m³/s] |
|---|---|---|---|
| 25.04.2024 | 47.4 | 47.8 | 47.1 |
| 24.04.2024 | 49.8 | 53.1 | 47.8 |
| 23.04.2024 | 59.7 | 67.8 | 53.1 |
| 22.04.2024 | 75.7 | 85.1 | 67.8 |
| 21.04.2024 | 101 | 110 | 86 |
| 20.04.2024 | 74.3 | 106 | 54.6 |
| 19.04.2024 | 58.8 | 61 | 55.4 |
© Bayerisches Landesamt für Umwelt 2024