
- Start >
- Rivers >
- Discharge >
- Untere Donau >
- Linden >
- Chart of total period

Chart of total period Linden / Sausswasser
Discharge from 01.11.1950 to 24.04.2024
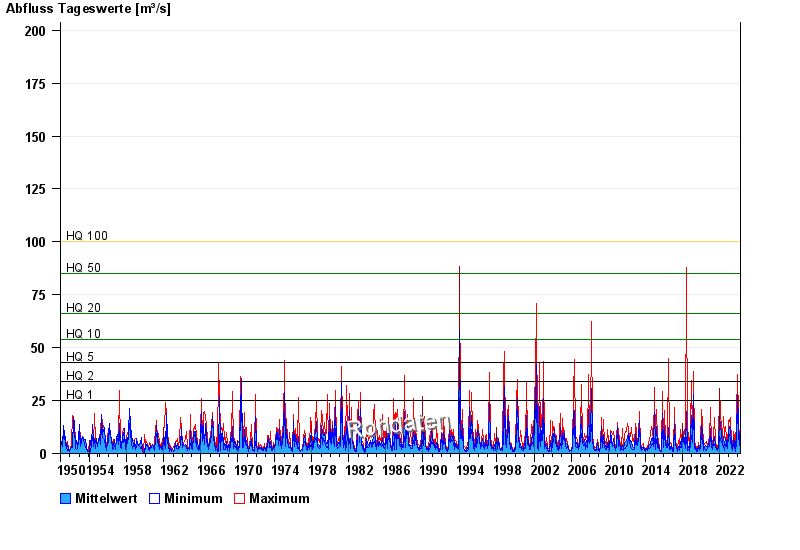
- HQ1 25 m³/s
- HQ2 34 m³/s
- HQ5 43 m³/s
- HQ10 54 m³/s
- HQ20 66 m³/s
- HQ50 85 m³/s
- HQ100 100 m³/s
| Date | Mean value [m³/s] | Maximum [m³/s] | Minimum [m³/s] |
|---|---|---|---|
| 24.04.2024 | 1.75 | 1.75 | 1.75 |
| 23.04.2024 | 1.8 | 1.86 | 1.75 |
| 22.04.2024 | 2.01 | 2.24 | 1.86 |
| 21.04.2024 | 2.54 | 3.38 | 2.24 |
| 20.04.2024 | 3.31 | 3.86 | 2.93 |
| 19.04.2024 | 2.09 | 3.08 | 1.75 |
| 18.04.2024 | 1.88 | 1.98 | 1.75 |
© Bayerisches Landesamt für Umwelt 2024