
- Start >
- Rivers >
- Discharge >
- Untere Donau >
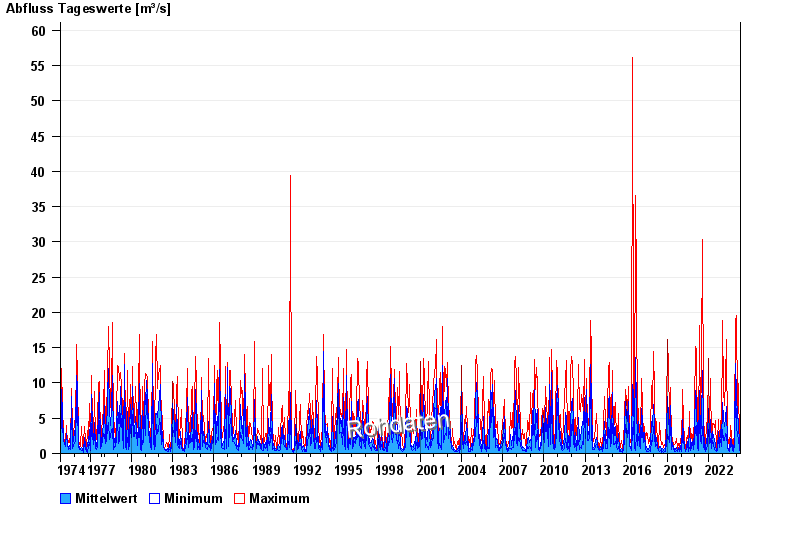
- Leming >
- Chart of total period

Chart of total period Leming / Freybach
Discharge from 01.11.1974 to 25.04.2024
| Date | Mean value [m³/s] | Maximum [m³/s] | Minimum [m³/s] |
|---|---|---|---|
| 25.04.2024 | 0.609 | 0.666 | 0.576 |
| 24.04.2024 | 0.661 | 0.711 | 0.619 |
| 23.04.2024 | 0.815 | 0.911 | 0.711 |
| 22.04.2024 | 1.23 | 1.77 | 0.911 |
| 21.04.2024 | 1.53 | 2.01 | 1.18 |
| 20.04.2024 | 4.07 | 7.4 | 1.77 |
| 19.04.2024 | 1.99 | 6.46 | 0.81 |
© Bayerisches Landesamt für Umwelt 2024