
- Start >
- Rivers >
- Discharge >
- Untere Donau >
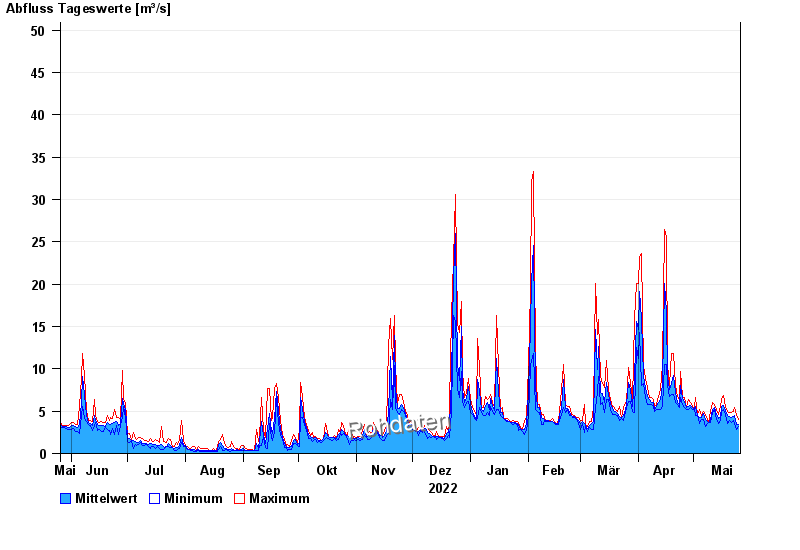
- Kothmaißling >
- Chart of year

Chart of year Kothmaißling / Chamb
Discharge from 26.05.2022 to 25.05.2023
note
Beeinflussung durch Buhneneinbau unterhalb vom Pegel
- 23.02.1970 Abfluss: 131 m³/s
- 13.08.2002 Abfluss: 130 m³/s
- 30.12.1986 Abfluss: 109 m³/s
- 16.10.1981 Abfluss: 108 m³/s
- 21.12.1993 Abfluss: 97,8 m³/s
| Date | Mean value [m³/s] | Maximum [m³/s] | Minimum [m³/s] |
|---|---|---|---|
| 25.05.2023 | 3.4 | 4.06 | 3.14 |
| 24.05.2023 | 3.44 | 4.62 | 2.8 |
| 23.05.2023 | 4.53 | 5.39 | 3.51 |
| 22.05.2023 | 4.38 | 5 | 3.87 |
| 21.05.2023 | 4.27 | 4.81 | 3.69 |
| 20.05.2023 | 4.4 | 4.81 | 3.87 |
| 19.05.2023 | 4.46 | 5 | 3.51 |
© Bayerisches Landesamt für Umwelt 2024