
- Start >
- Rivers >
- Discharge >
- Untere Donau >
- Kollbach >
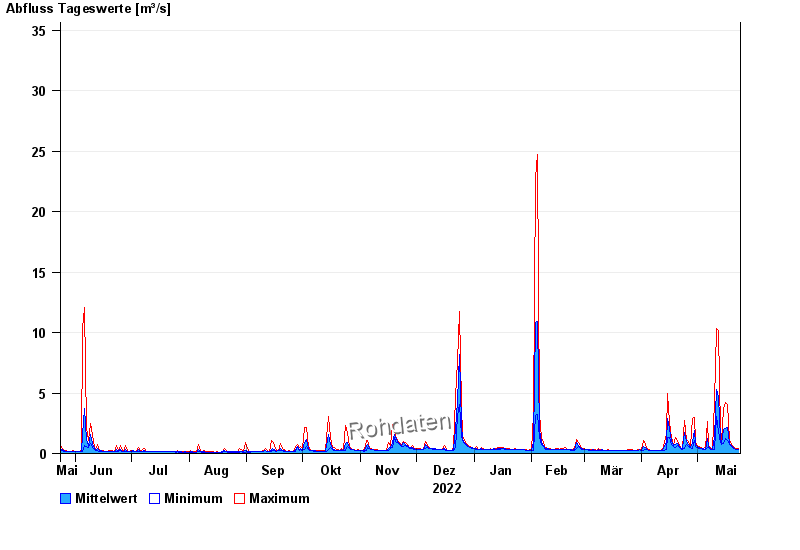
- Chart of year

Chart of year Kollbach / Kollbach
Discharge from 24.05.2022 to 23.05.2023
- 10.06.1965 Abfluss: 49 m³/s
- 22.06.1965 Abfluss: 48,1 m³/s
- 01.06.1965 Abfluss: 45,9 m³/s
- 02.06.1995 Abfluss: 45,5 m³/s
- 15.02.1990 Abfluss: 44,4 m³/s
| Date | Mean value [m³/s] | Maximum [m³/s] | Minimum [m³/s] |
|---|---|---|---|
| 23.05.2023 | 0.342 | 0.373 | 0.314 |
| 22.05.2023 | 0.371 | 0.405 | 0.343 |
| 21.05.2023 | 0.428 | 0.439 | 0.373 |
| 20.05.2023 | 0.508 | 0.549 | 0.439 |
| 19.05.2023 | 0.636 | 0.71 | 0.549 |
| 18.05.2023 | 0.867 | 1.11 | 0.71 |
| 17.05.2023 | 2.13 | 4.02 | 1.11 |
© Bayerisches Landesamt für Umwelt 2024