
- Start >
- Rivers >
- Discharge >
- Untere Donau >
- Kollbach >
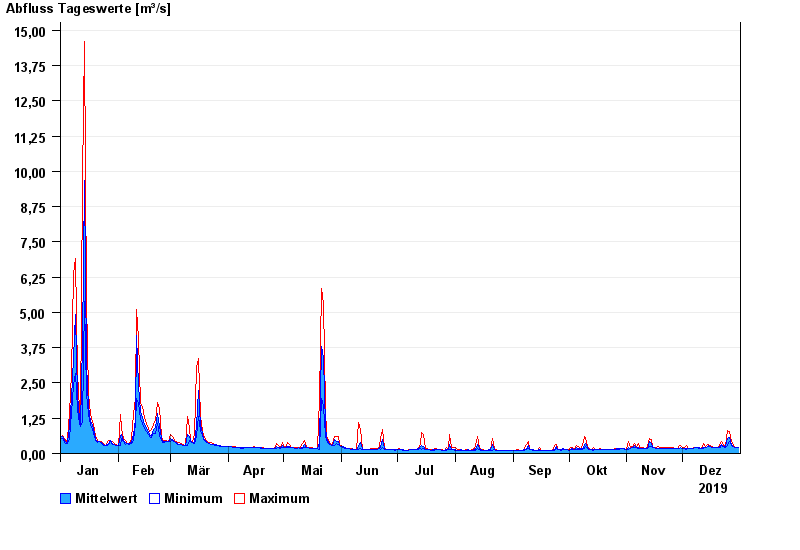
- Chart of year

Chart of year Kollbach / Kollbach
Discharge from 01.01.2019 to 31.12.2019
| Date | Mean value [m³/s] | Maximum [m³/s] | Minimum [m³/s] |
|---|---|---|---|
| 31.12.2019 | 0.202 | 0.222 | 0.201 |
| 30.12.2019 | 0.21 | 0.222 | 0.201 |
| 29.12.2019 | 0.229 | 0.245 | 0.222 |
| 28.12.2019 | 0.261 | 0.295 | 0.245 |
| 27.12.2019 | 0.336 | 0.415 | 0.295 |
| 26.12.2019 | 0.559 | 0.796 | 0.415 |
| 25.12.2019 | 0.523 | 0.809 | 0.294 |
© Bayerisches Landesamt für Umwelt 2024