
- Start >
- Rivers >
- Discharge >
- Untere Donau >
- Kollbach >
- Chart of year

Chart of year Kollbach / Kollbach
Discharge from 01.01.2018 to 31.12.2018
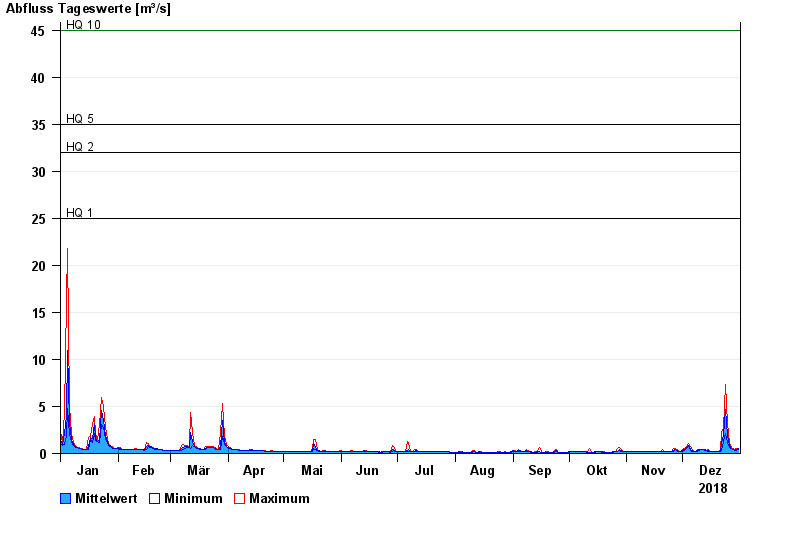
- HQ1 25 m³/s
- HQ2 32 m³/s
- HQ5 35 m³/s
- HQ10 45 m³/s
- HQ20 57 m³/s
- HQ50 72 m³/s
- HQ100 90 m³/s
| Date | Mean value [m³/s] | Maximum [m³/s] | Minimum [m³/s] |
|---|---|---|---|
| 31.12.2018 | 0.486 | 0.569 | 0.458 |
| 30.12.2018 | 0.431 | 0.569 | 0.33 |
| 29.12.2018 | 0.348 | 0.391 | 0.33 |
| 28.12.2018 | 0.431 | 0.494 | 0.391 |
| 27.12.2018 | 0.566 | 0.689 | 0.494 |
| 26.12.2018 | 0.867 | 1.14 | 0.689 |
| 25.12.2018 | 1.9 | 3.21 | 1.14 |
© Bayerisches Landesamt für Umwelt 2024