
- Start >
- Rivers >
- Discharge >
- Untere Donau >
- Kollbach >
- Chart of year

Chart of year Kollbach / Kollbach
Discharge from 01.01.2021 to 31.12.2021
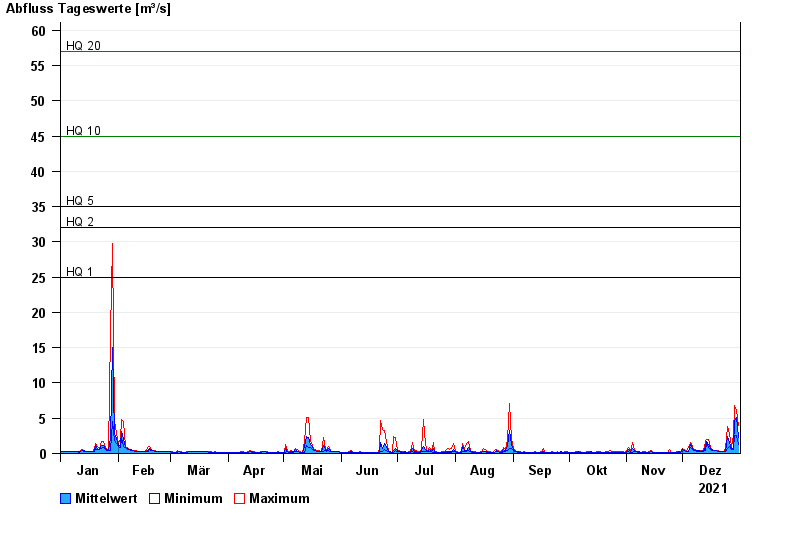
- HQ1 25 m³/s
- HQ2 32 m³/s
- HQ5 35 m³/s
- HQ10 45 m³/s
- HQ20 57 m³/s
- HQ50 72 m³/s
- HQ100 90 m³/s
| Date | Mean value [m³/s] | Maximum [m³/s] | Minimum [m³/s] |
|---|---|---|---|
| 31.12.2021 | 2.23 | 3.96 | 1.32 |
| 30.12.2021 | 5.1 | 6.1 | 2.52 |
| 29.12.2021 | 4.73 | 6.76 | 2.52 |
| 28.12.2021 | 0.74 | 2.52 | 0.575 |
| 27.12.2021 | 0.755 | 0.986 | 0.613 |
| 26.12.2021 | 1.63 | 2.73 | 0.986 |
| 25.12.2021 | 2.36 | 3.78 | 0.651 |
© Bayerisches Landesamt für Umwelt 2024