
- Start >
- Rivers >
- Discharge >
- Untere Donau >
- Kollbach >
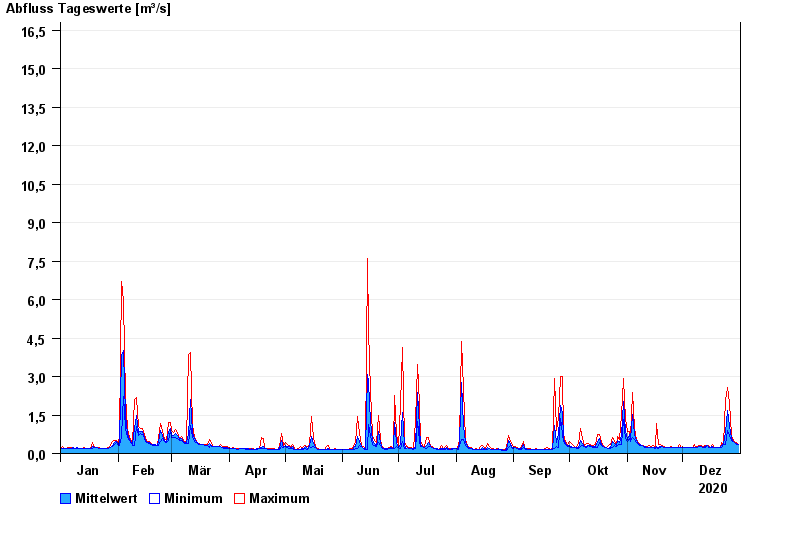
- Chart of year

Chart of year Kollbach / Kollbach
Discharge from 01.01.2020 to 31.12.2020
- HQ1 25 m³/s
- HQ2 32 m³/s
- HQ5 35 m³/s
- HQ10 45 m³/s
- HQ20 57 m³/s
- HQ50 72 m³/s
- HQ100 90 m³/s
| Date | Mean value [m³/s] | Maximum [m³/s] | Minimum [m³/s] |
|---|---|---|---|
| 31.12.2020 | 0.351 | 0.352 | 0.351 |
| 30.12.2020 | 0.386 | 0.415 | 0.352 |
| 29.12.2020 | 0.448 | 0.484 | 0.415 |
| 28.12.2020 | 0.482 | 0.521 | 0.449 |
| 27.12.2020 | 0.579 | 0.719 | 0.521 |
| 26.12.2020 | 1.11 | 1.94 | 0.719 |
| 25.12.2020 | 1.68 | 2.59 | 0.891 |
© Bayerisches Landesamt für Umwelt 2024