
- Start >
- Rivers >
- Discharge >
- Untere Donau >
- Kollbach >
- Chart of total period

Chart of total period Kollbach / Kollbach
Discharge from 01.11.1963 to 23.04.2024
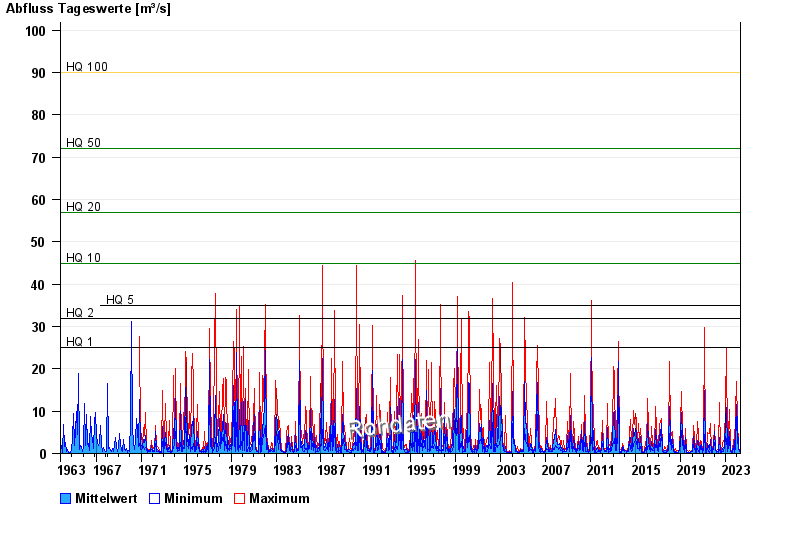
- HQ1 25 m³/s
- HQ2 32 m³/s
- HQ5 35 m³/s
- HQ10 45 m³/s
- HQ20 57 m³/s
- HQ50 72 m³/s
- HQ100 90 m³/s
| Date | Mean value [m³/s] | Maximum [m³/s] | Minimum [m³/s] |
|---|---|---|---|
| 23.04.2024 | 0.358 | 0.364 | 0.304 |
| 22.04.2024 | 0.449 | 0.5 | 0.364 |
| 21.04.2024 | 0.377 | 0.538 | 0.304 |
| 20.04.2024 | 0.38 | 0.429 | 0.333 |
| 19.04.2024 | 0.326 | 0.395 | 0.304 |
| 18.04.2024 | 0.352 | 0.429 | 0.333 |
| 17.04.2024 | 0.413 | 0.617 | 0.333 |
© Bayerisches Landesamt für Umwelt 2024