
- Start >
- Rivers >
- Discharge >
- Untere Donau >
- Köfering >
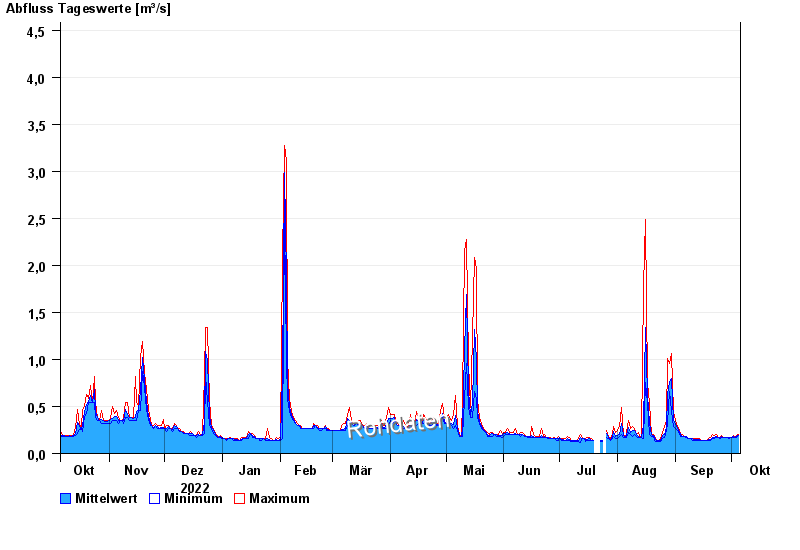
- Chart of year

Chart of year Köfering / Pfatter
Discharge from 06.10.2022 to 05.10.2023
- 14.01.2011 Abfluss: 16,8 m³/s
- 02.03.1987 Abfluss: 12,1 m³/s
- 09.03.2006 Abfluss: 10,8 m³/s
- 16.03.1988 Abfluss: 10,5 m³/s
- 21.12.1993 Abfluss: 10,3 m³/s
| Date | Mean value [m³/s] | Maximum [m³/s] | Minimum [m³/s] |
|---|---|---|---|
| 05.10.2023 | 0.194 | 0.207 | 0.189 |
| 04.10.2023 | 0.179 | 0.189 | 0.172 |
| 03.10.2023 | 0.172 | 0.172 | 0.172 |
| 02.10.2023 | 0.176 | 0.189 | 0.172 |
| 01.10.2023 | 0.172 | 0.172 | 0.172 |
| 30.09.2023 | 0.169 | 0.172 | 0.157 |
| 29.09.2023 | 0.172 | 0.172 | 0.172 |
© Bayerisches Landesamt für Umwelt 2024